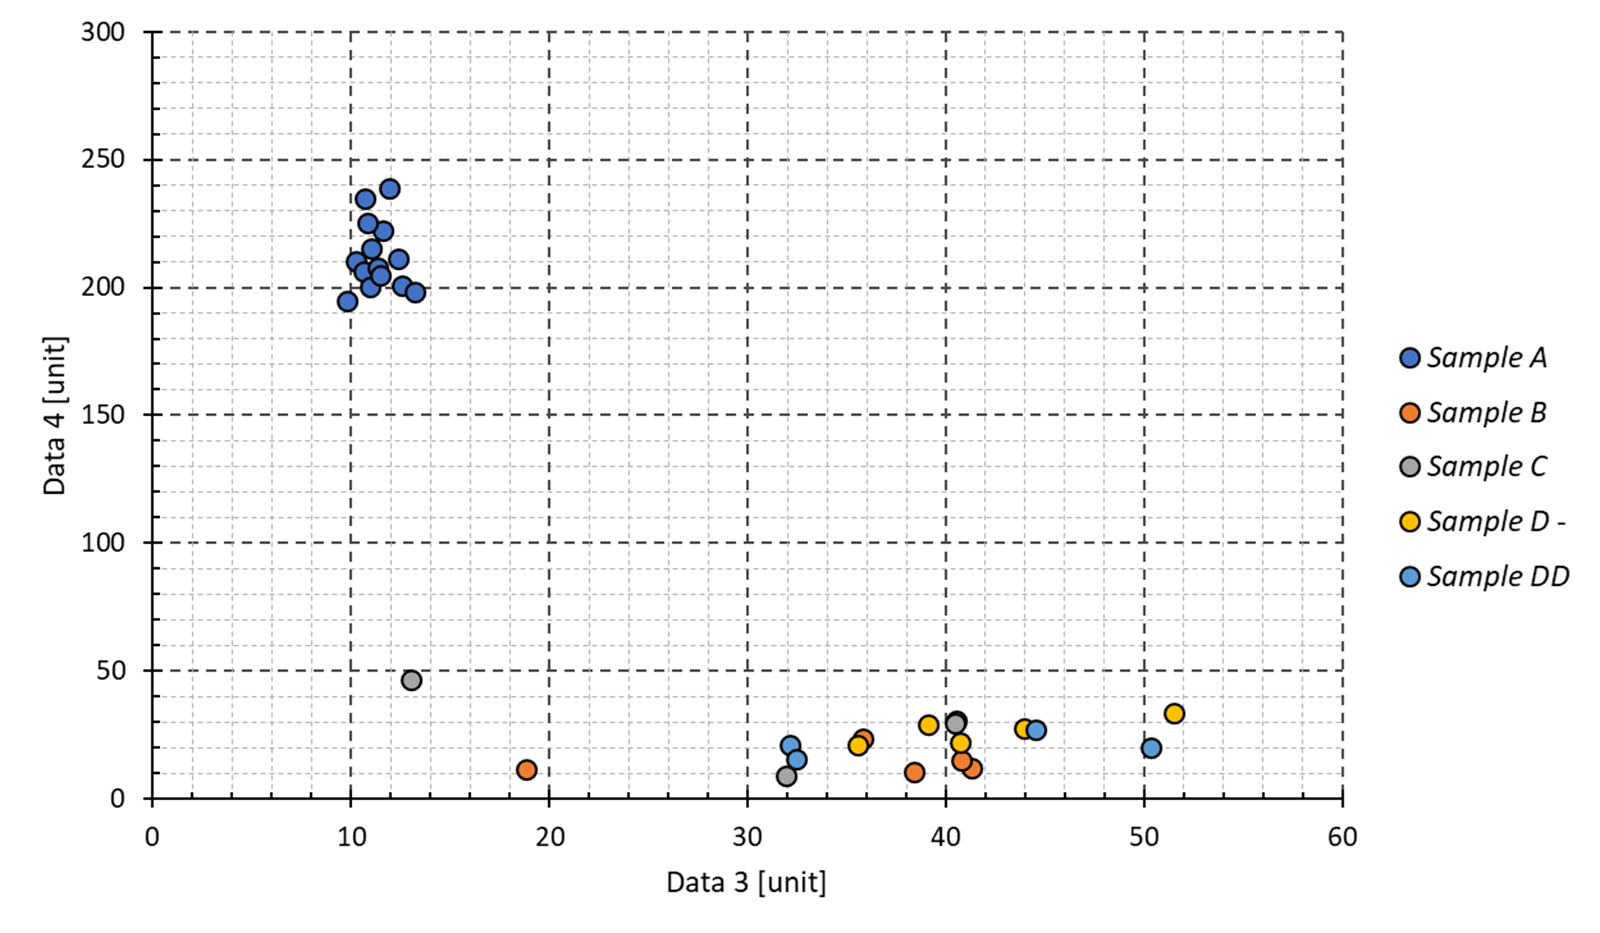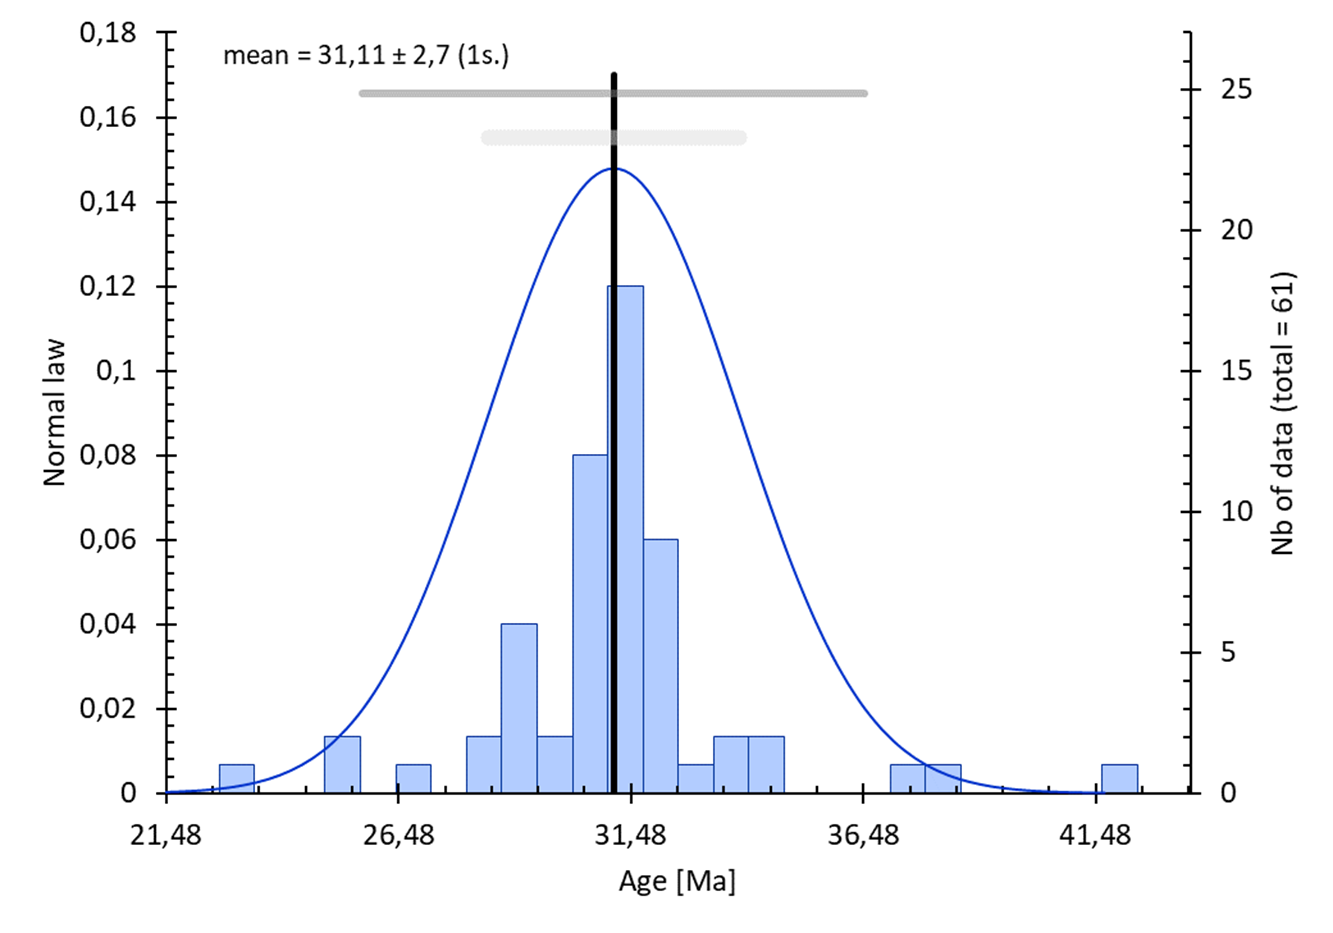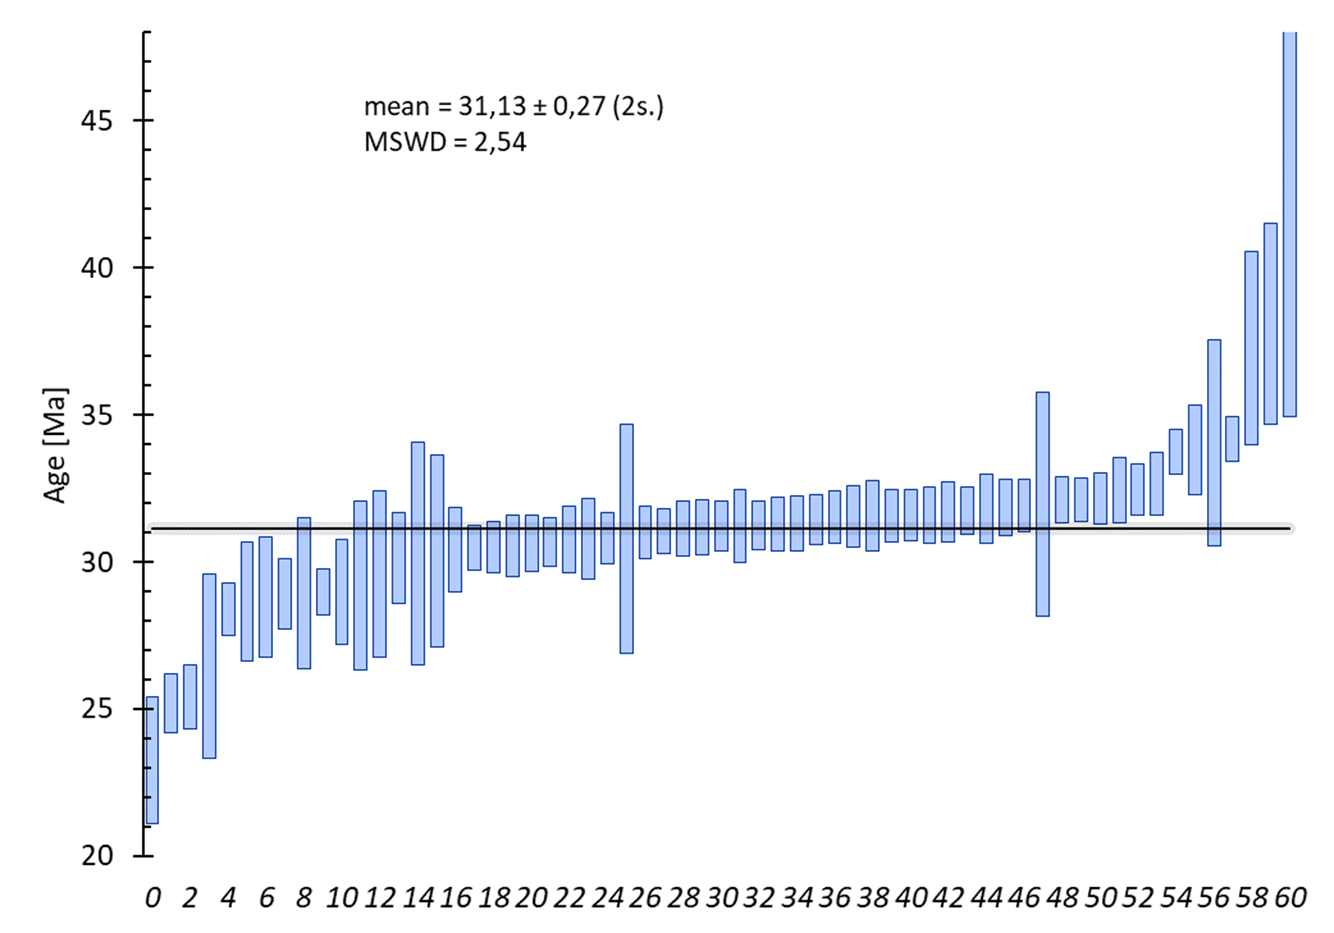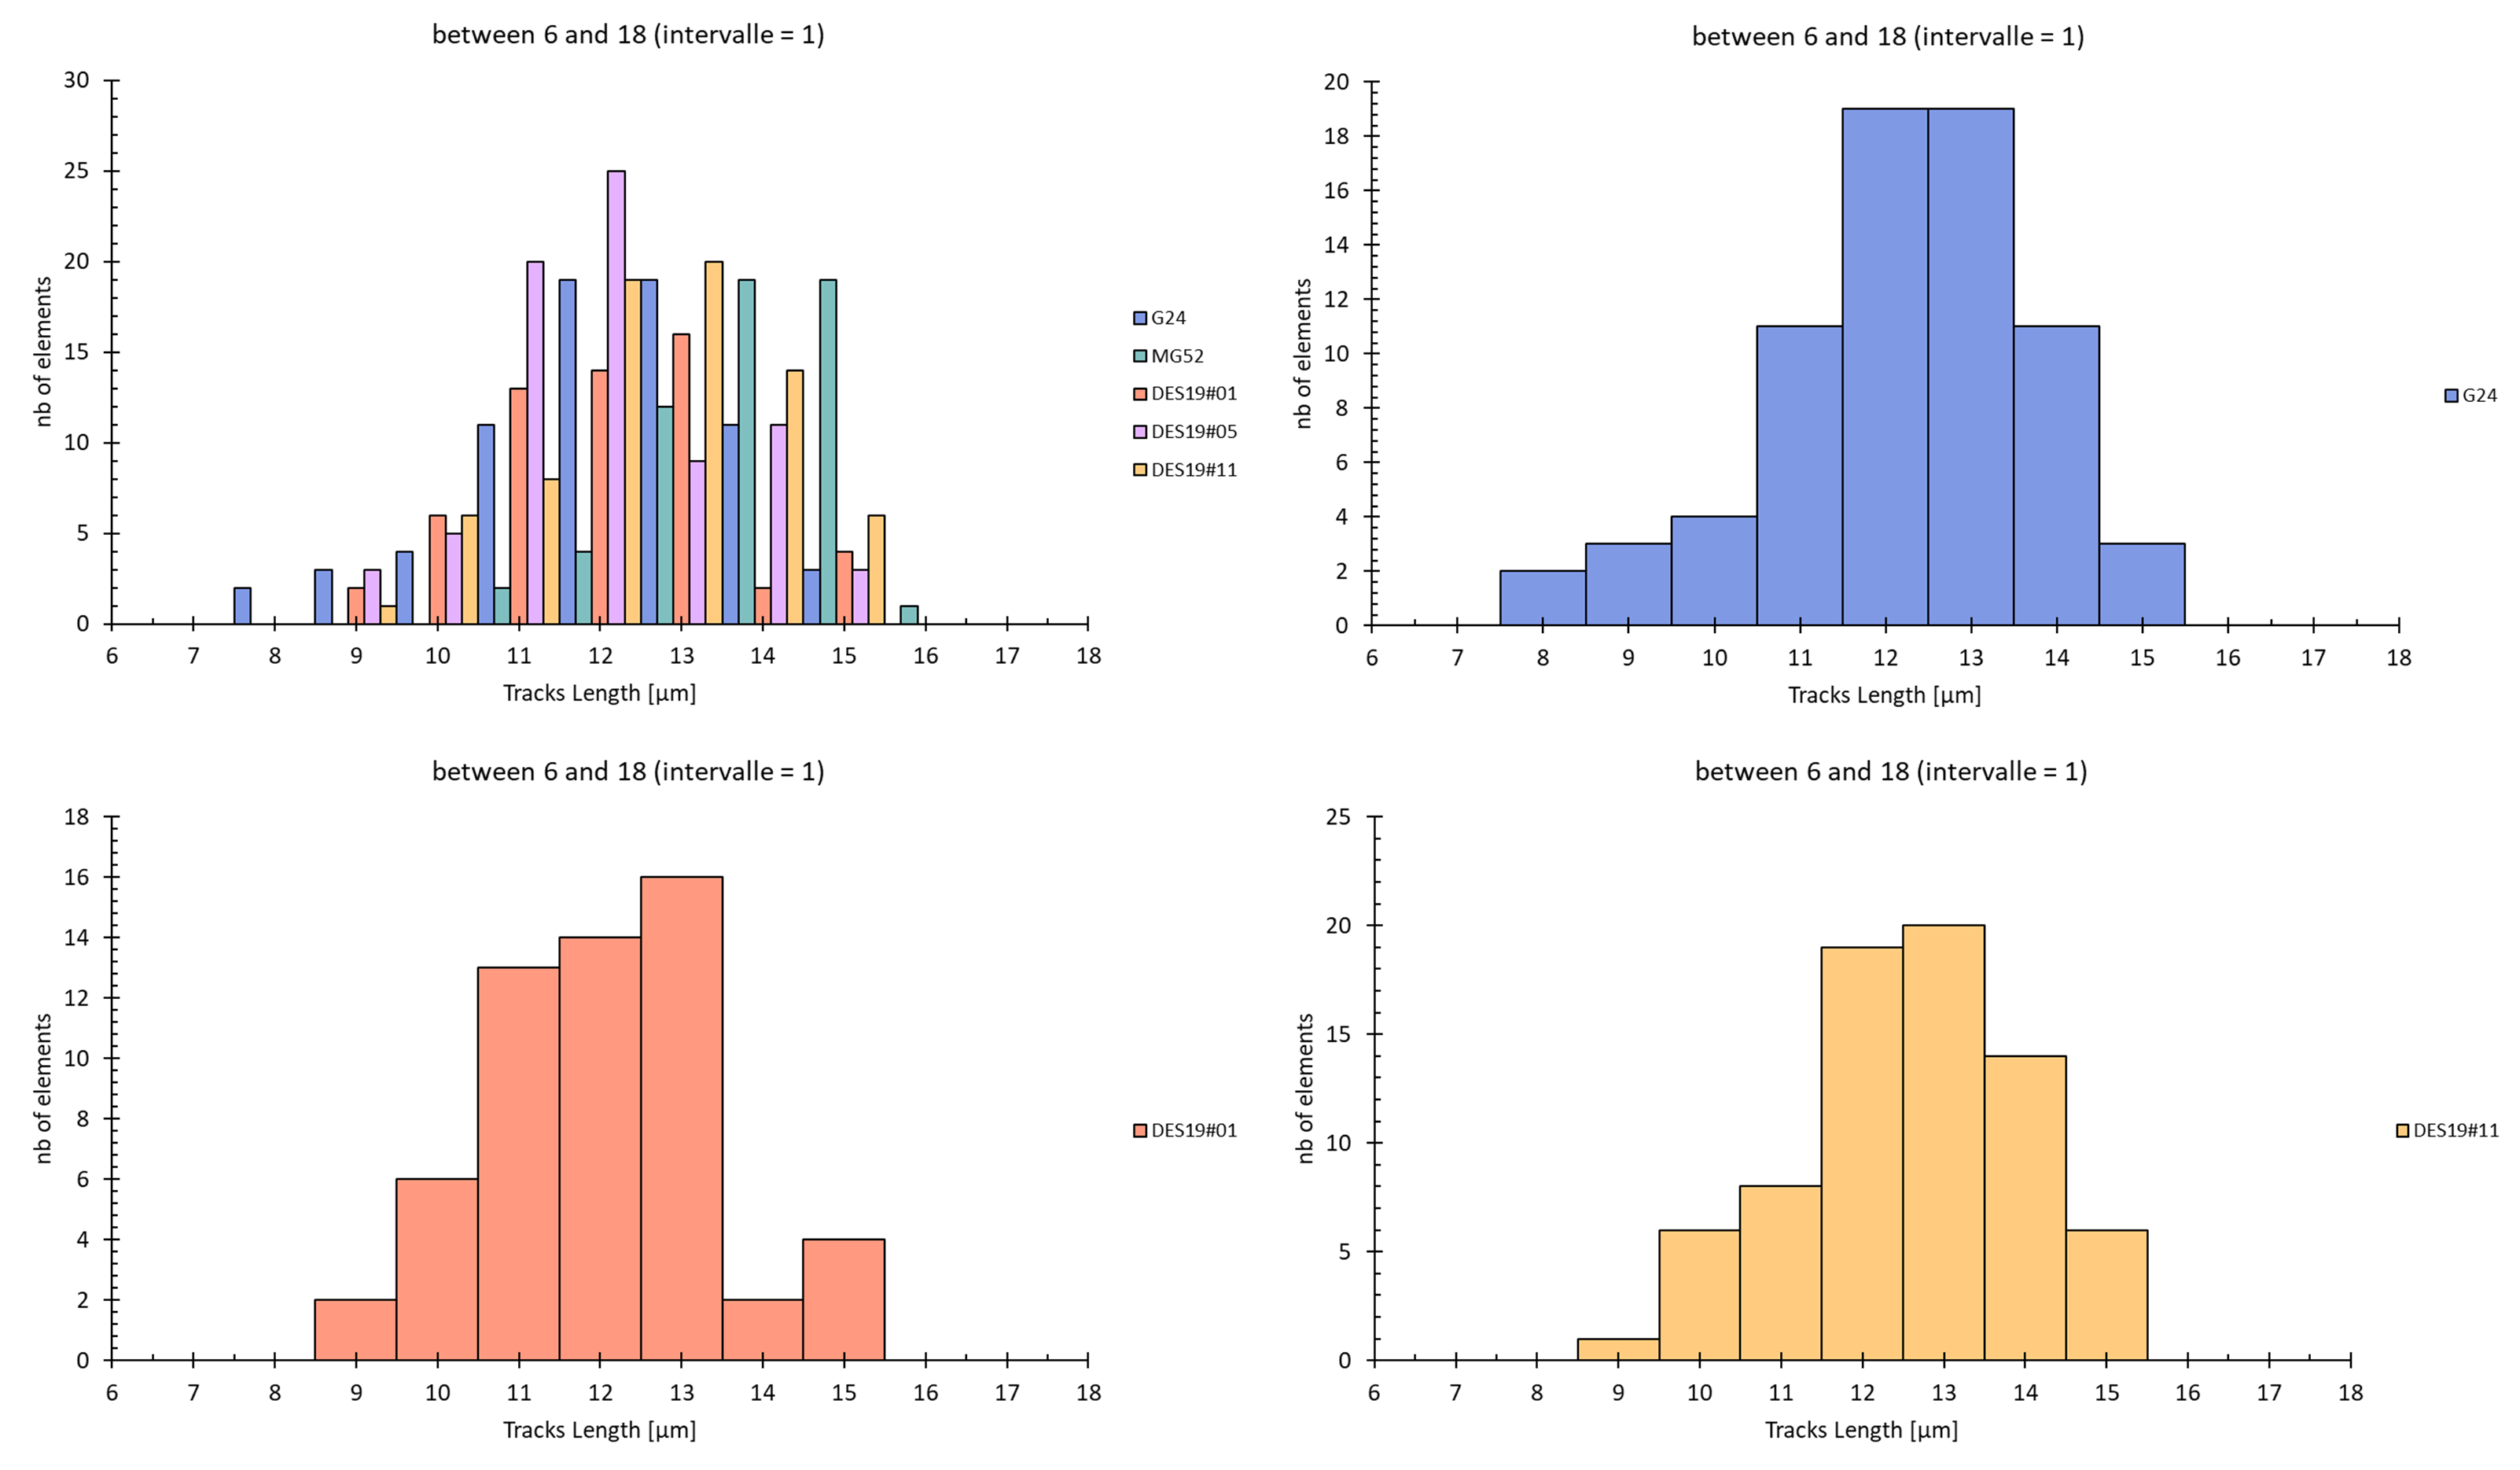
What is Better Plot Excel?
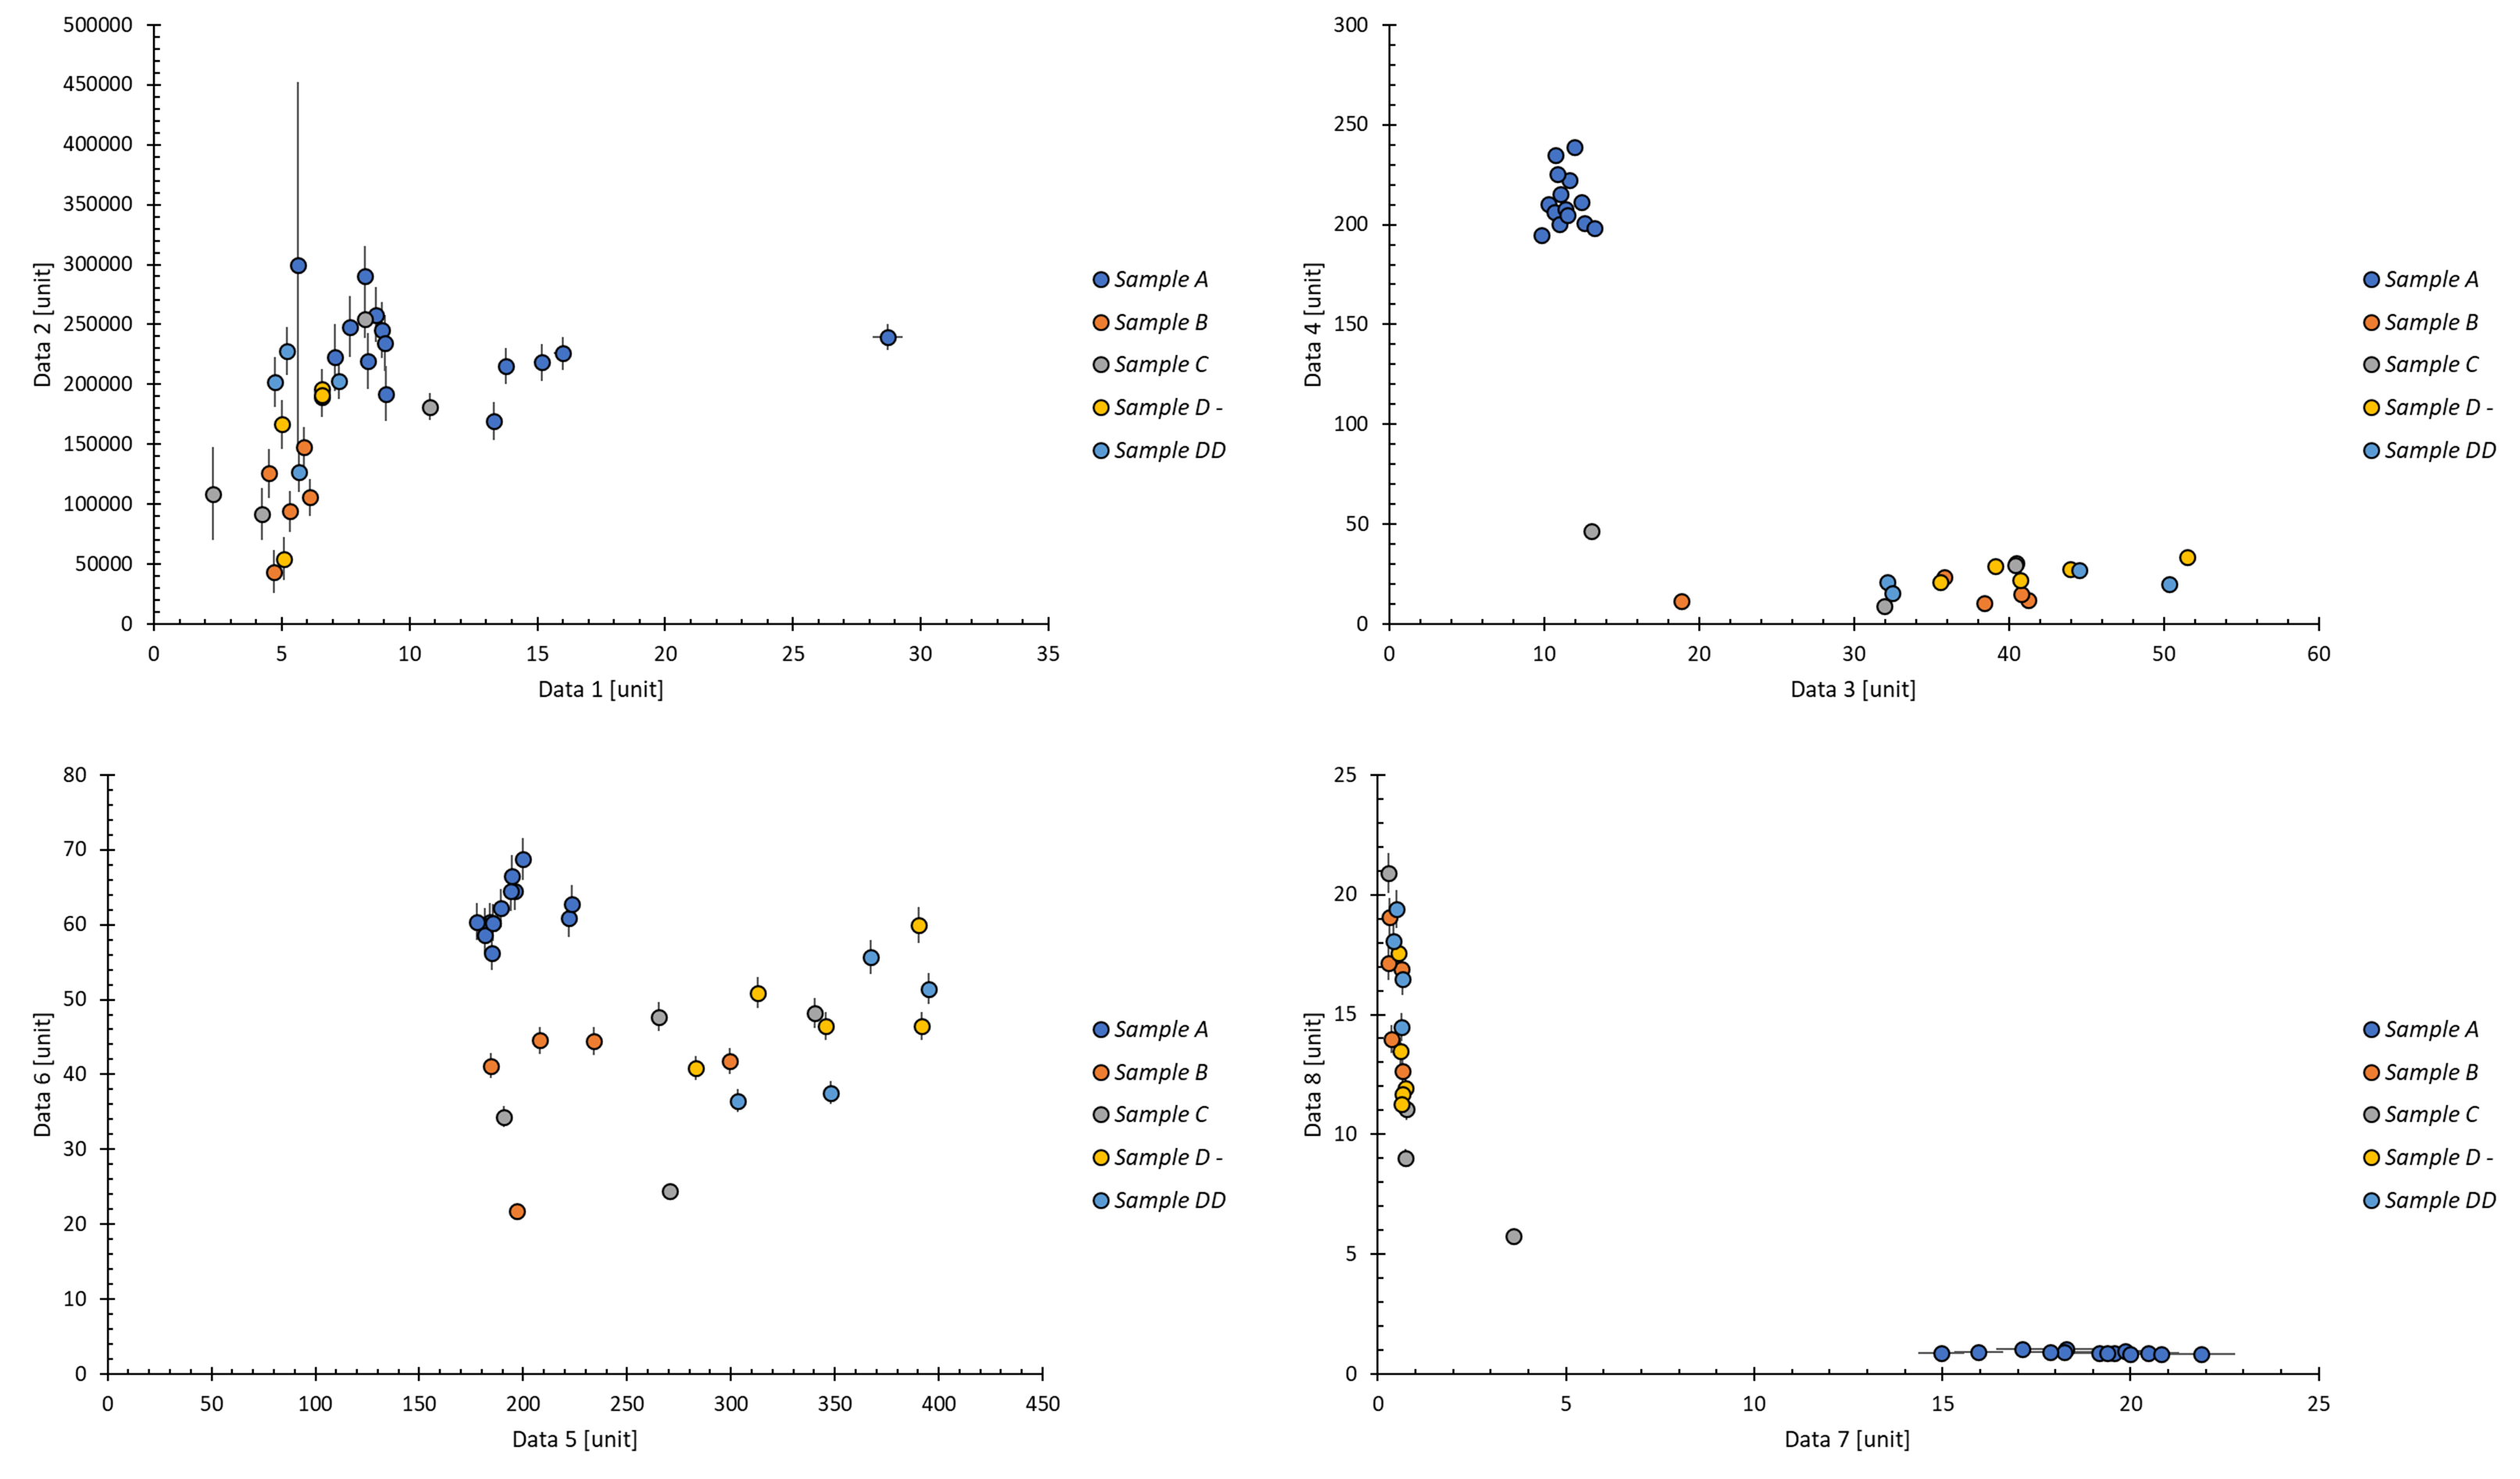
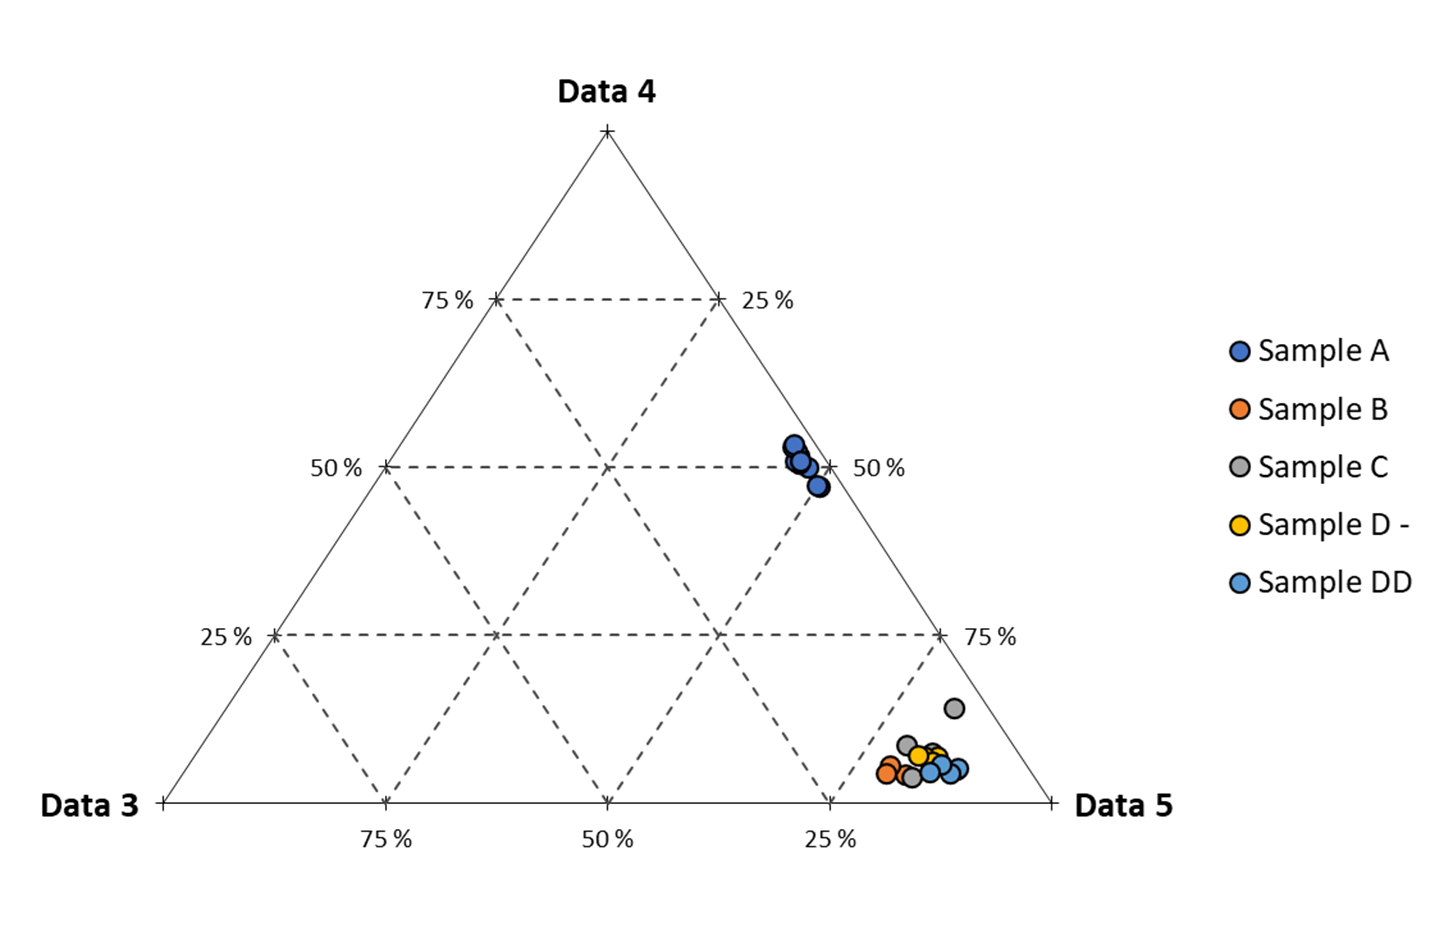
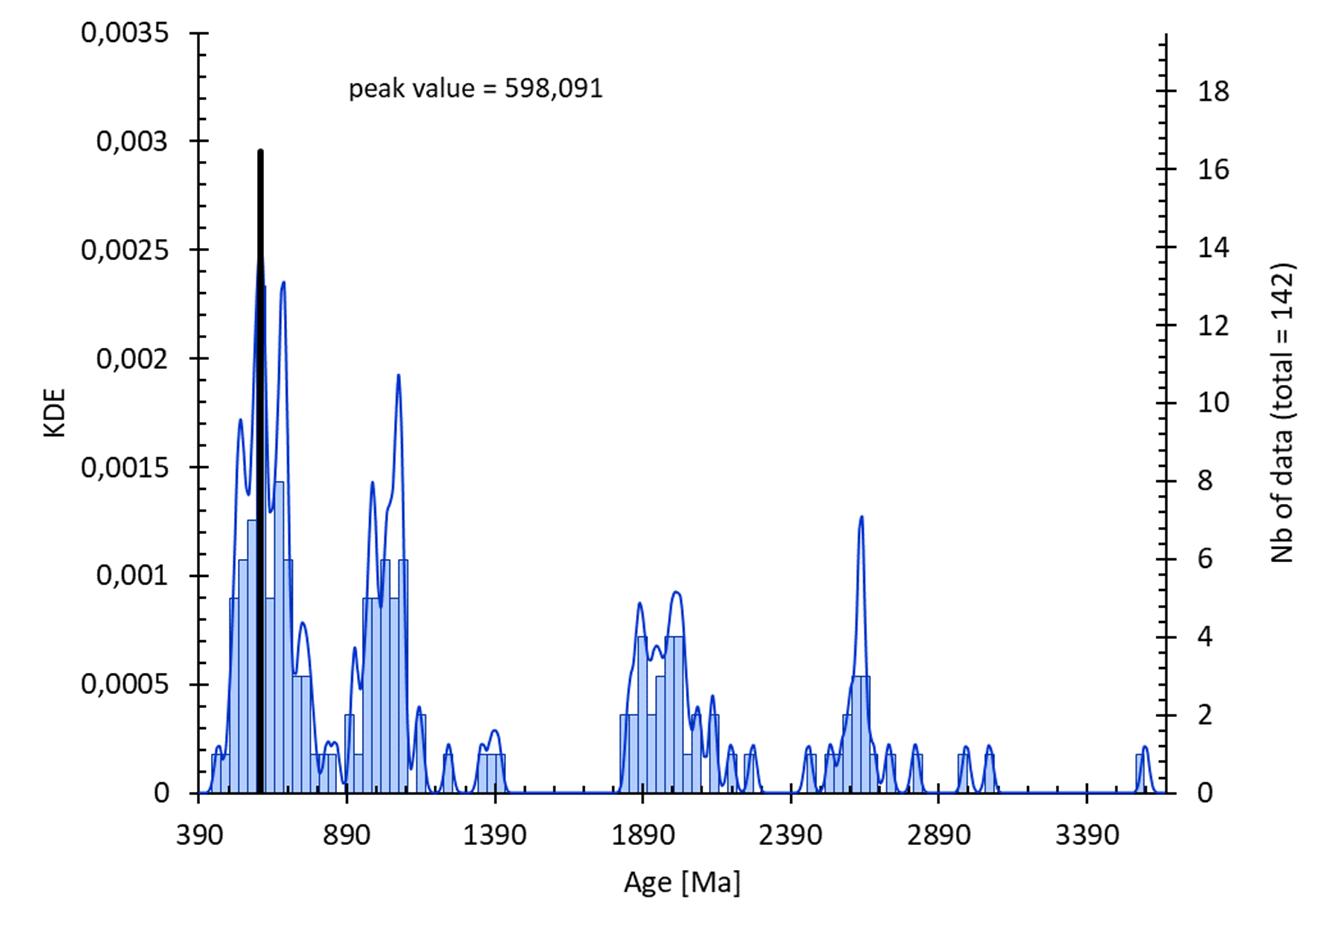
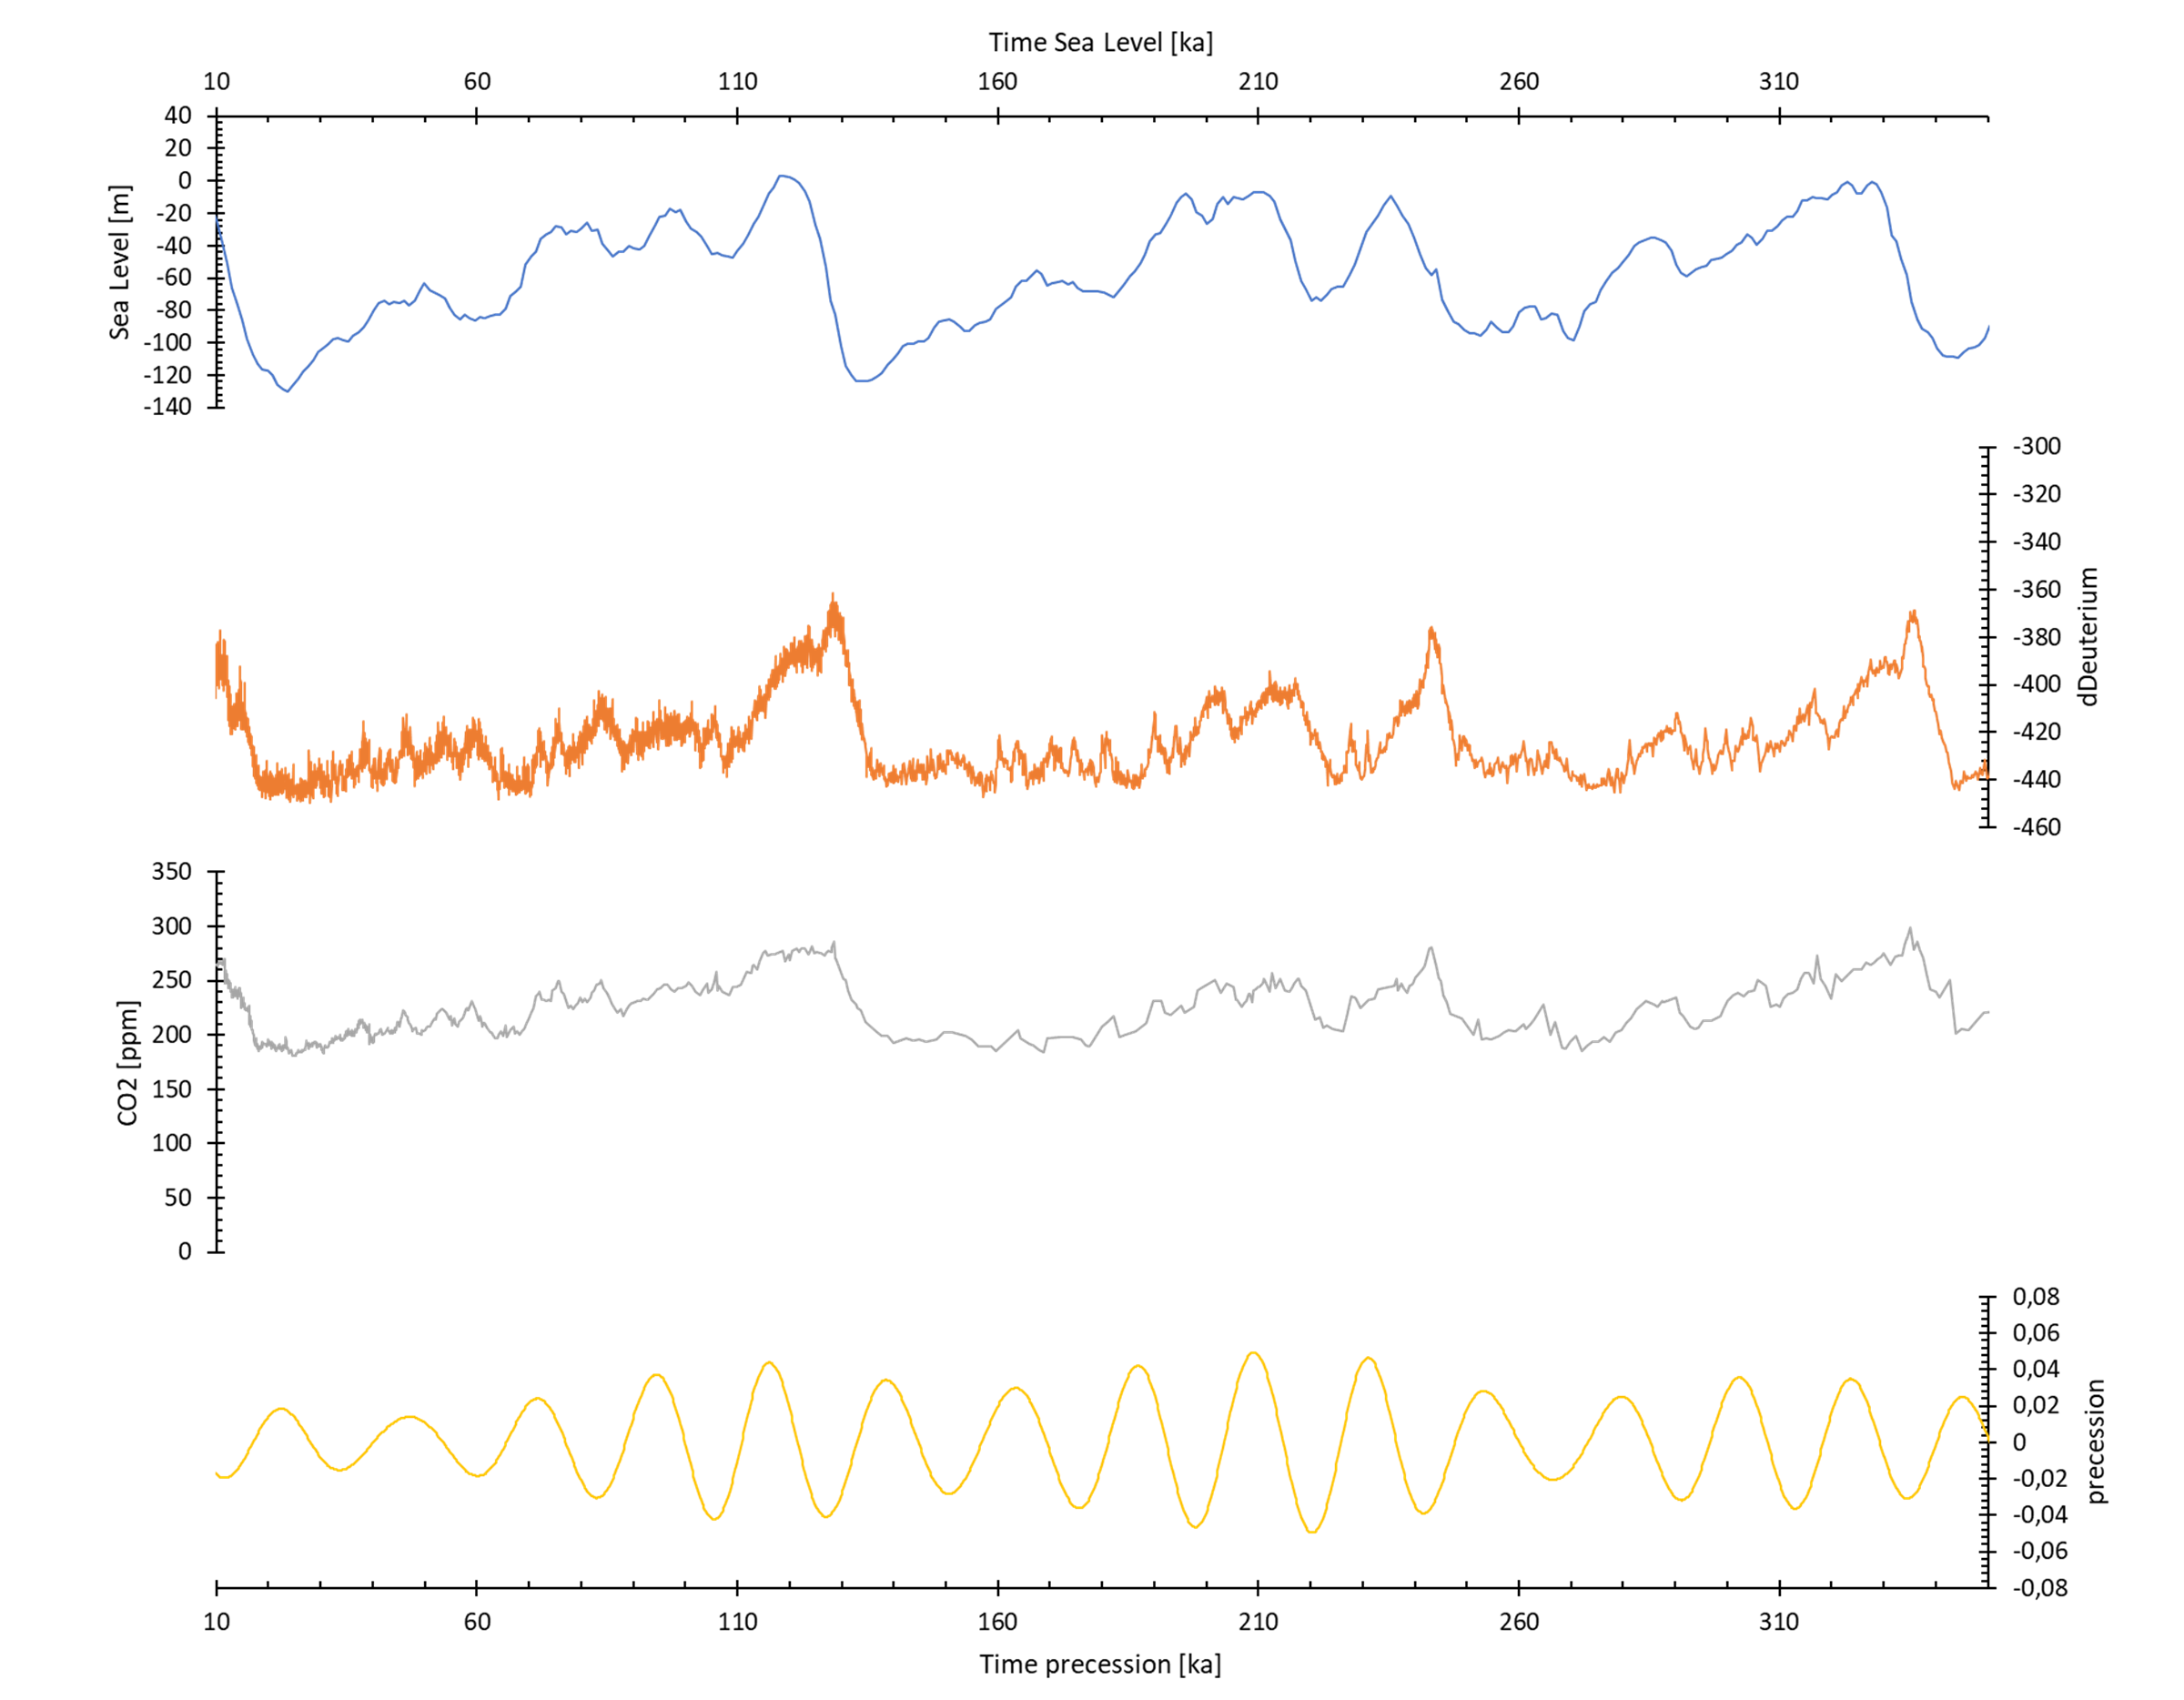
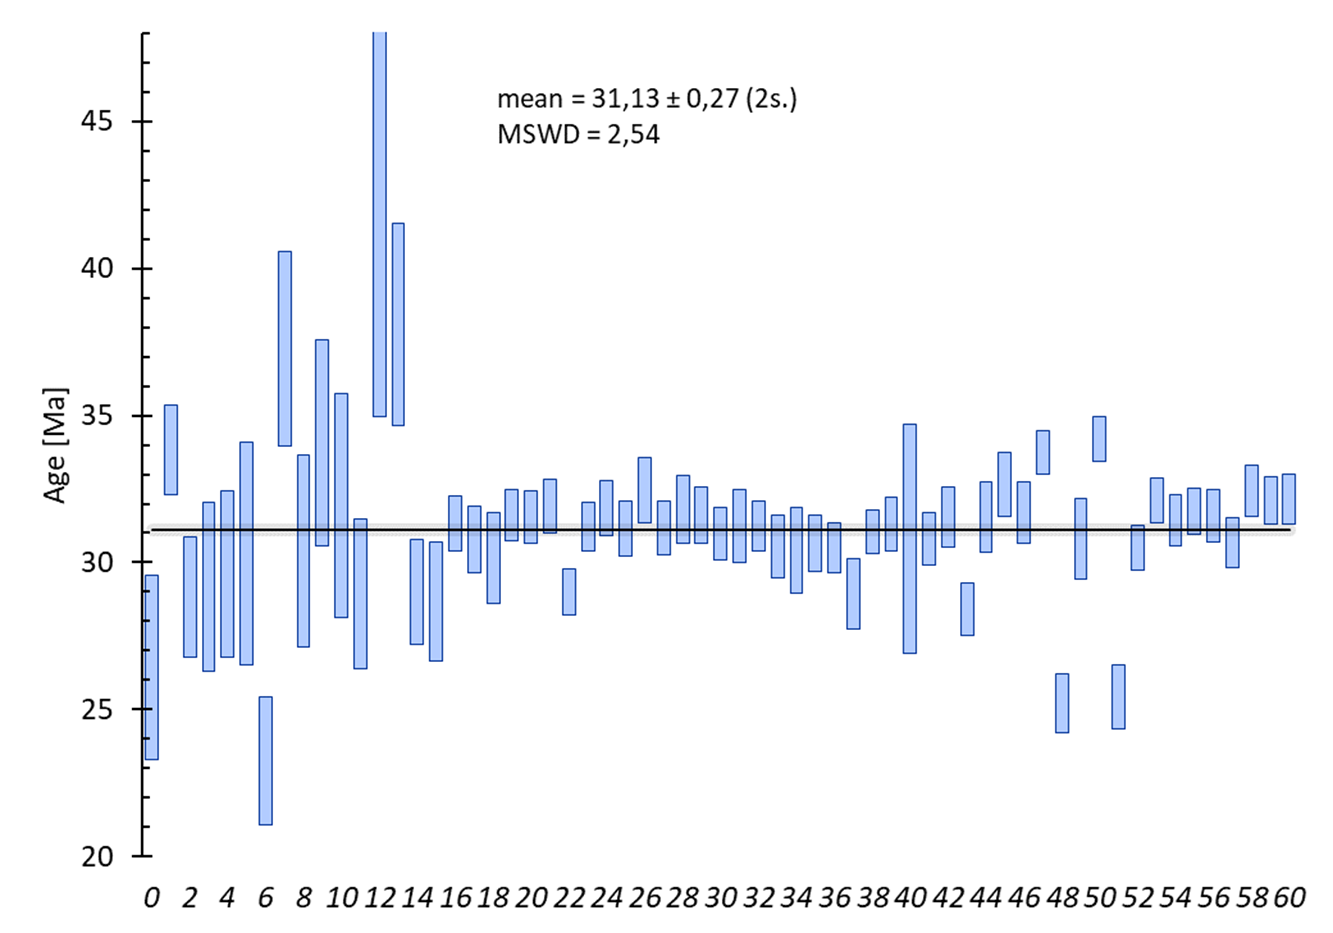
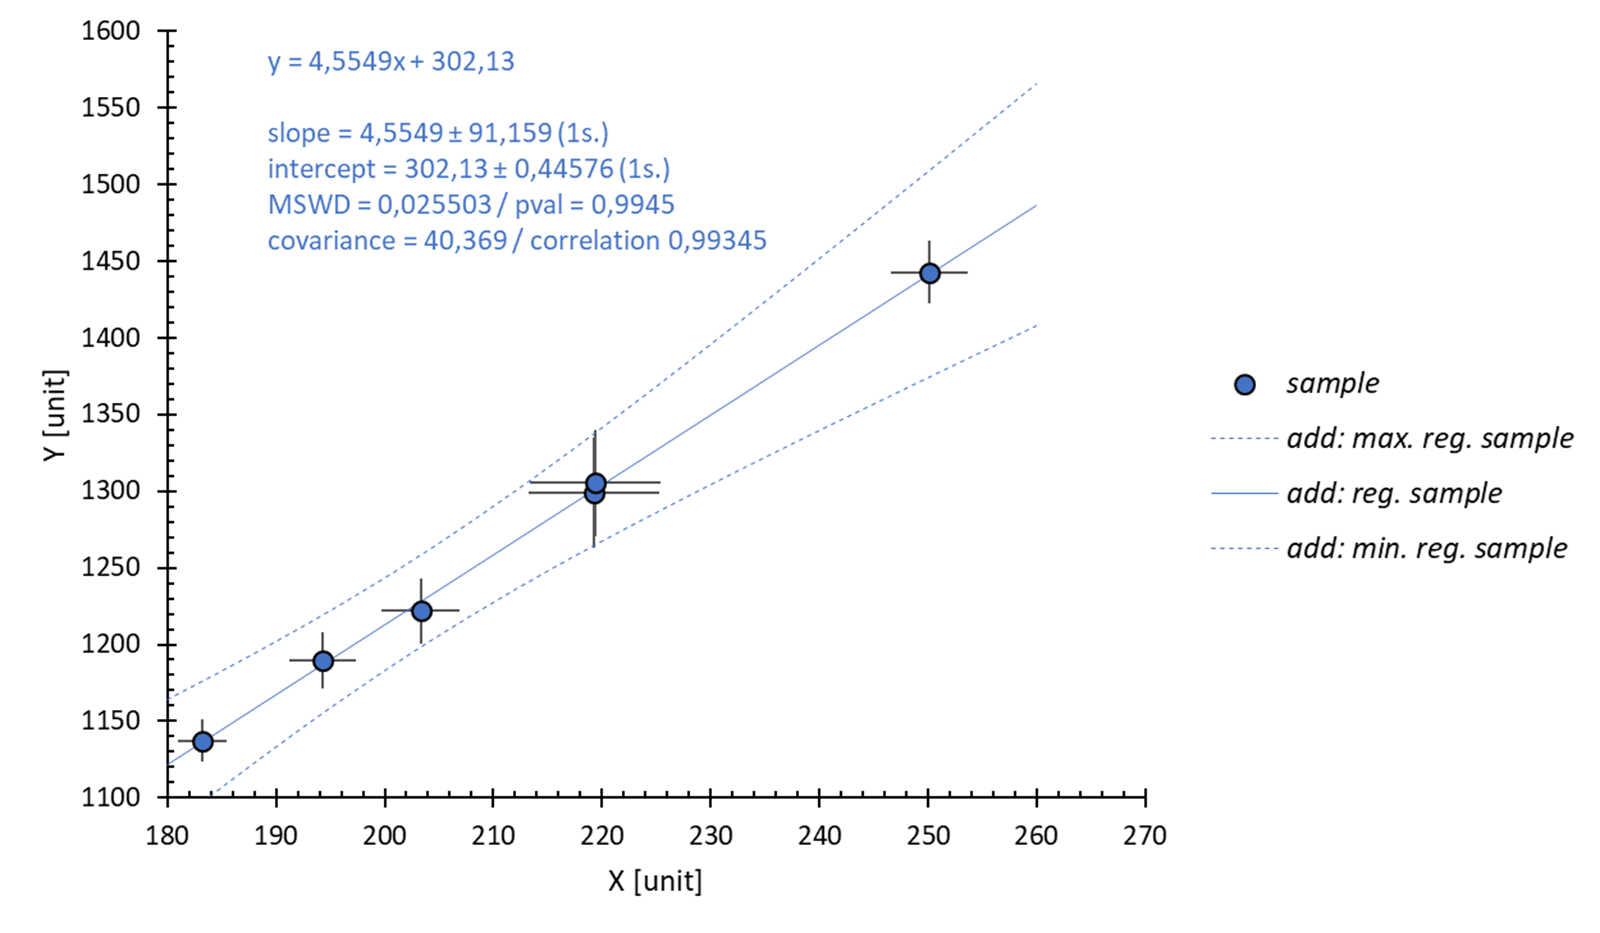
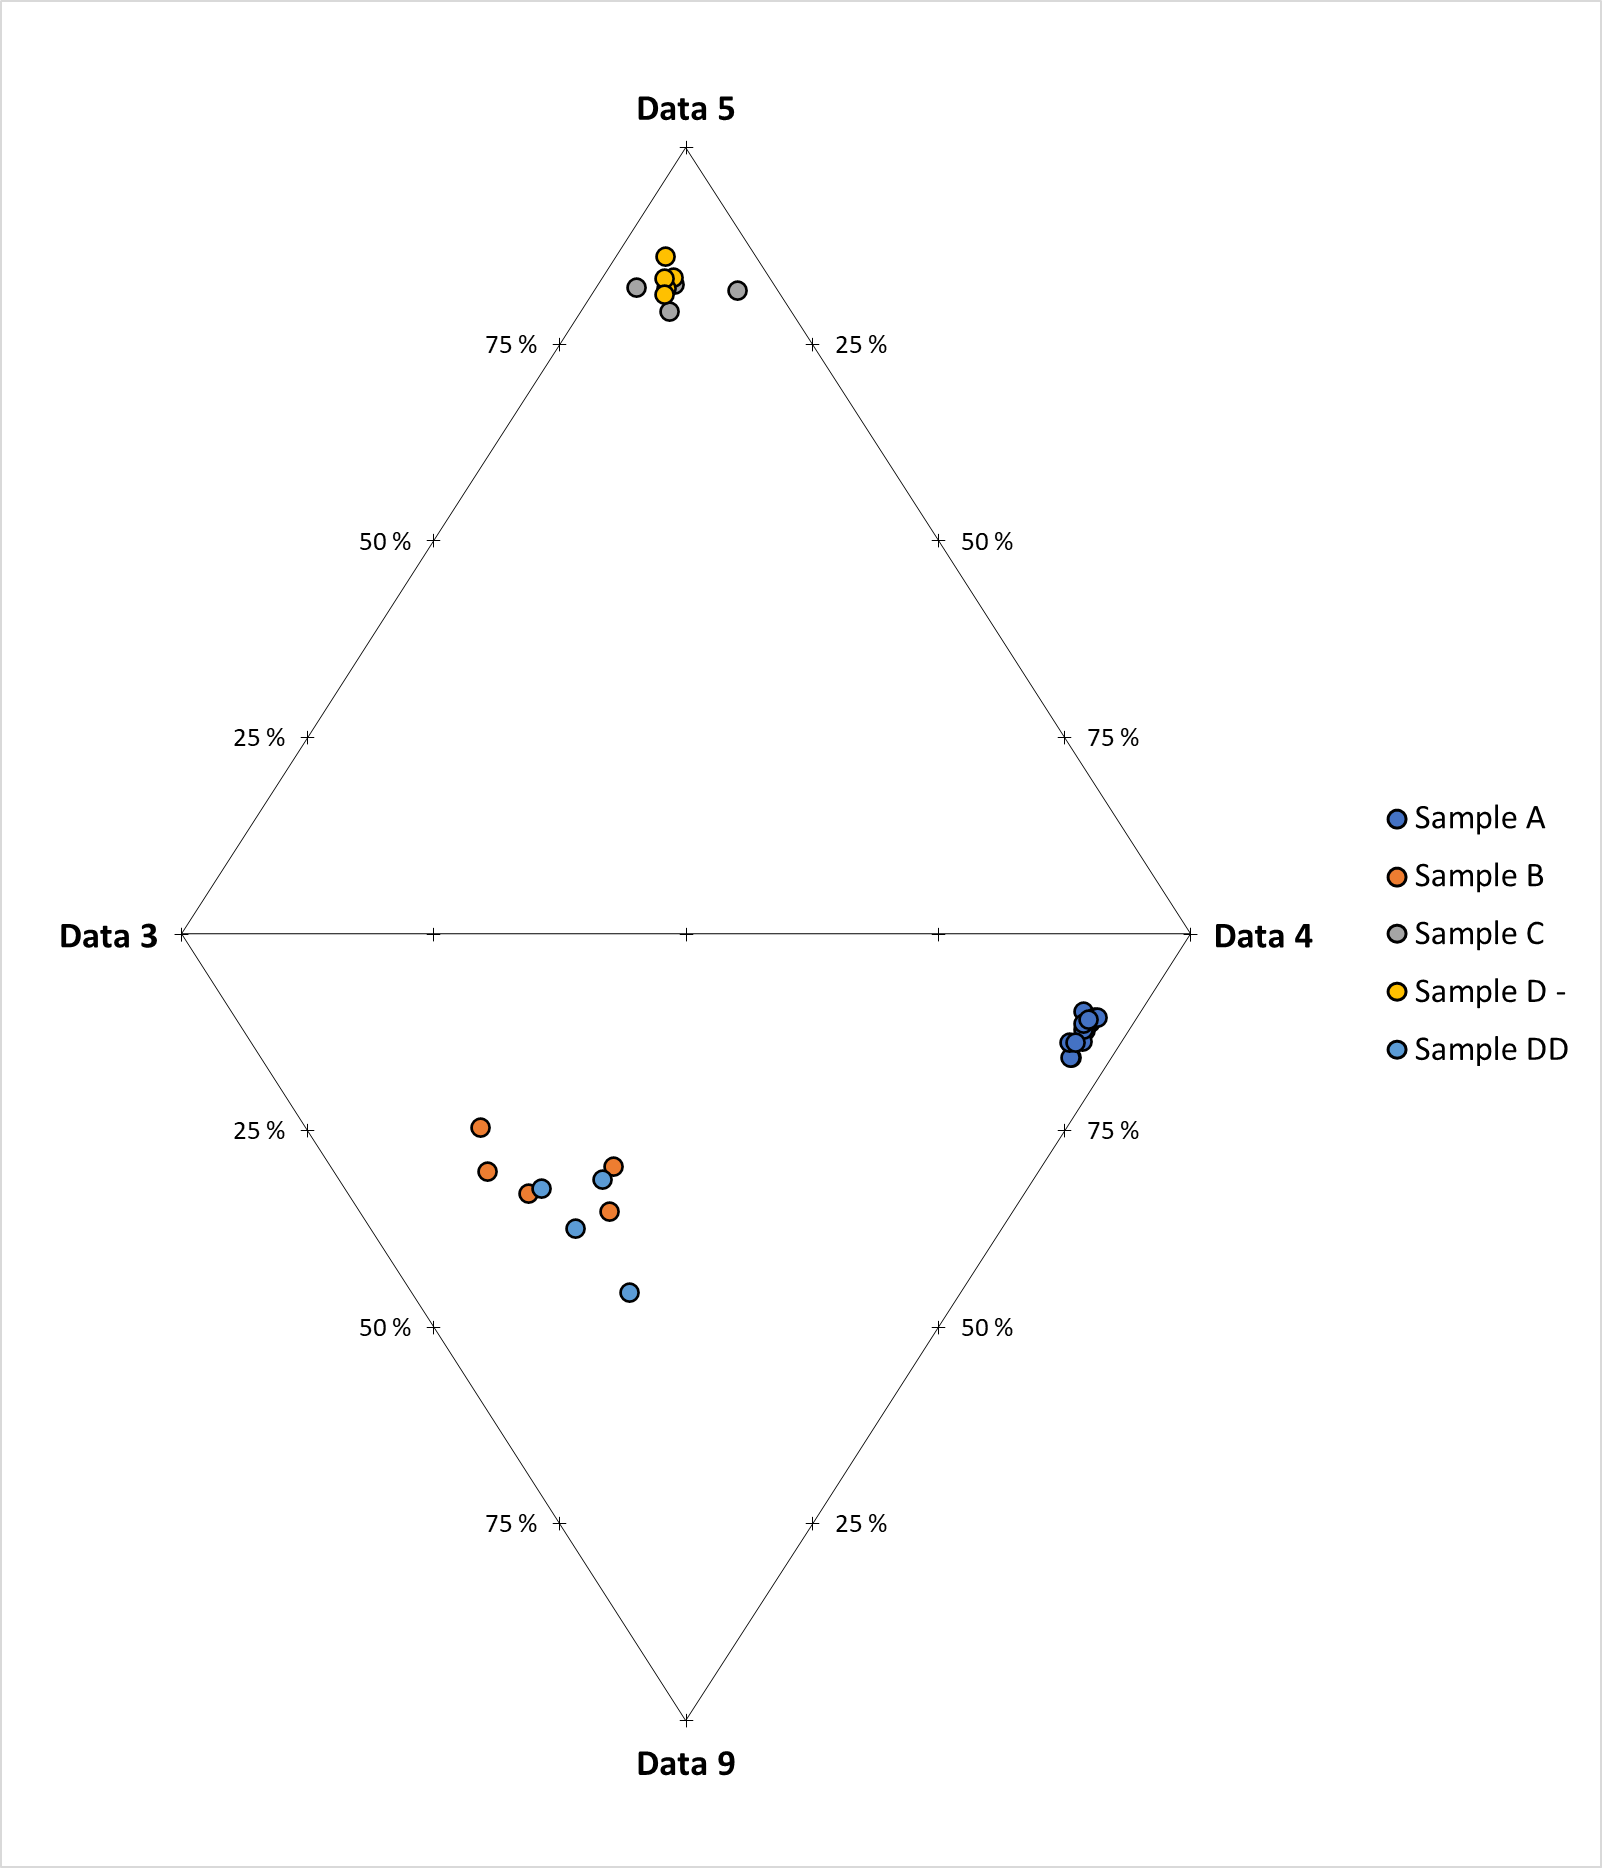
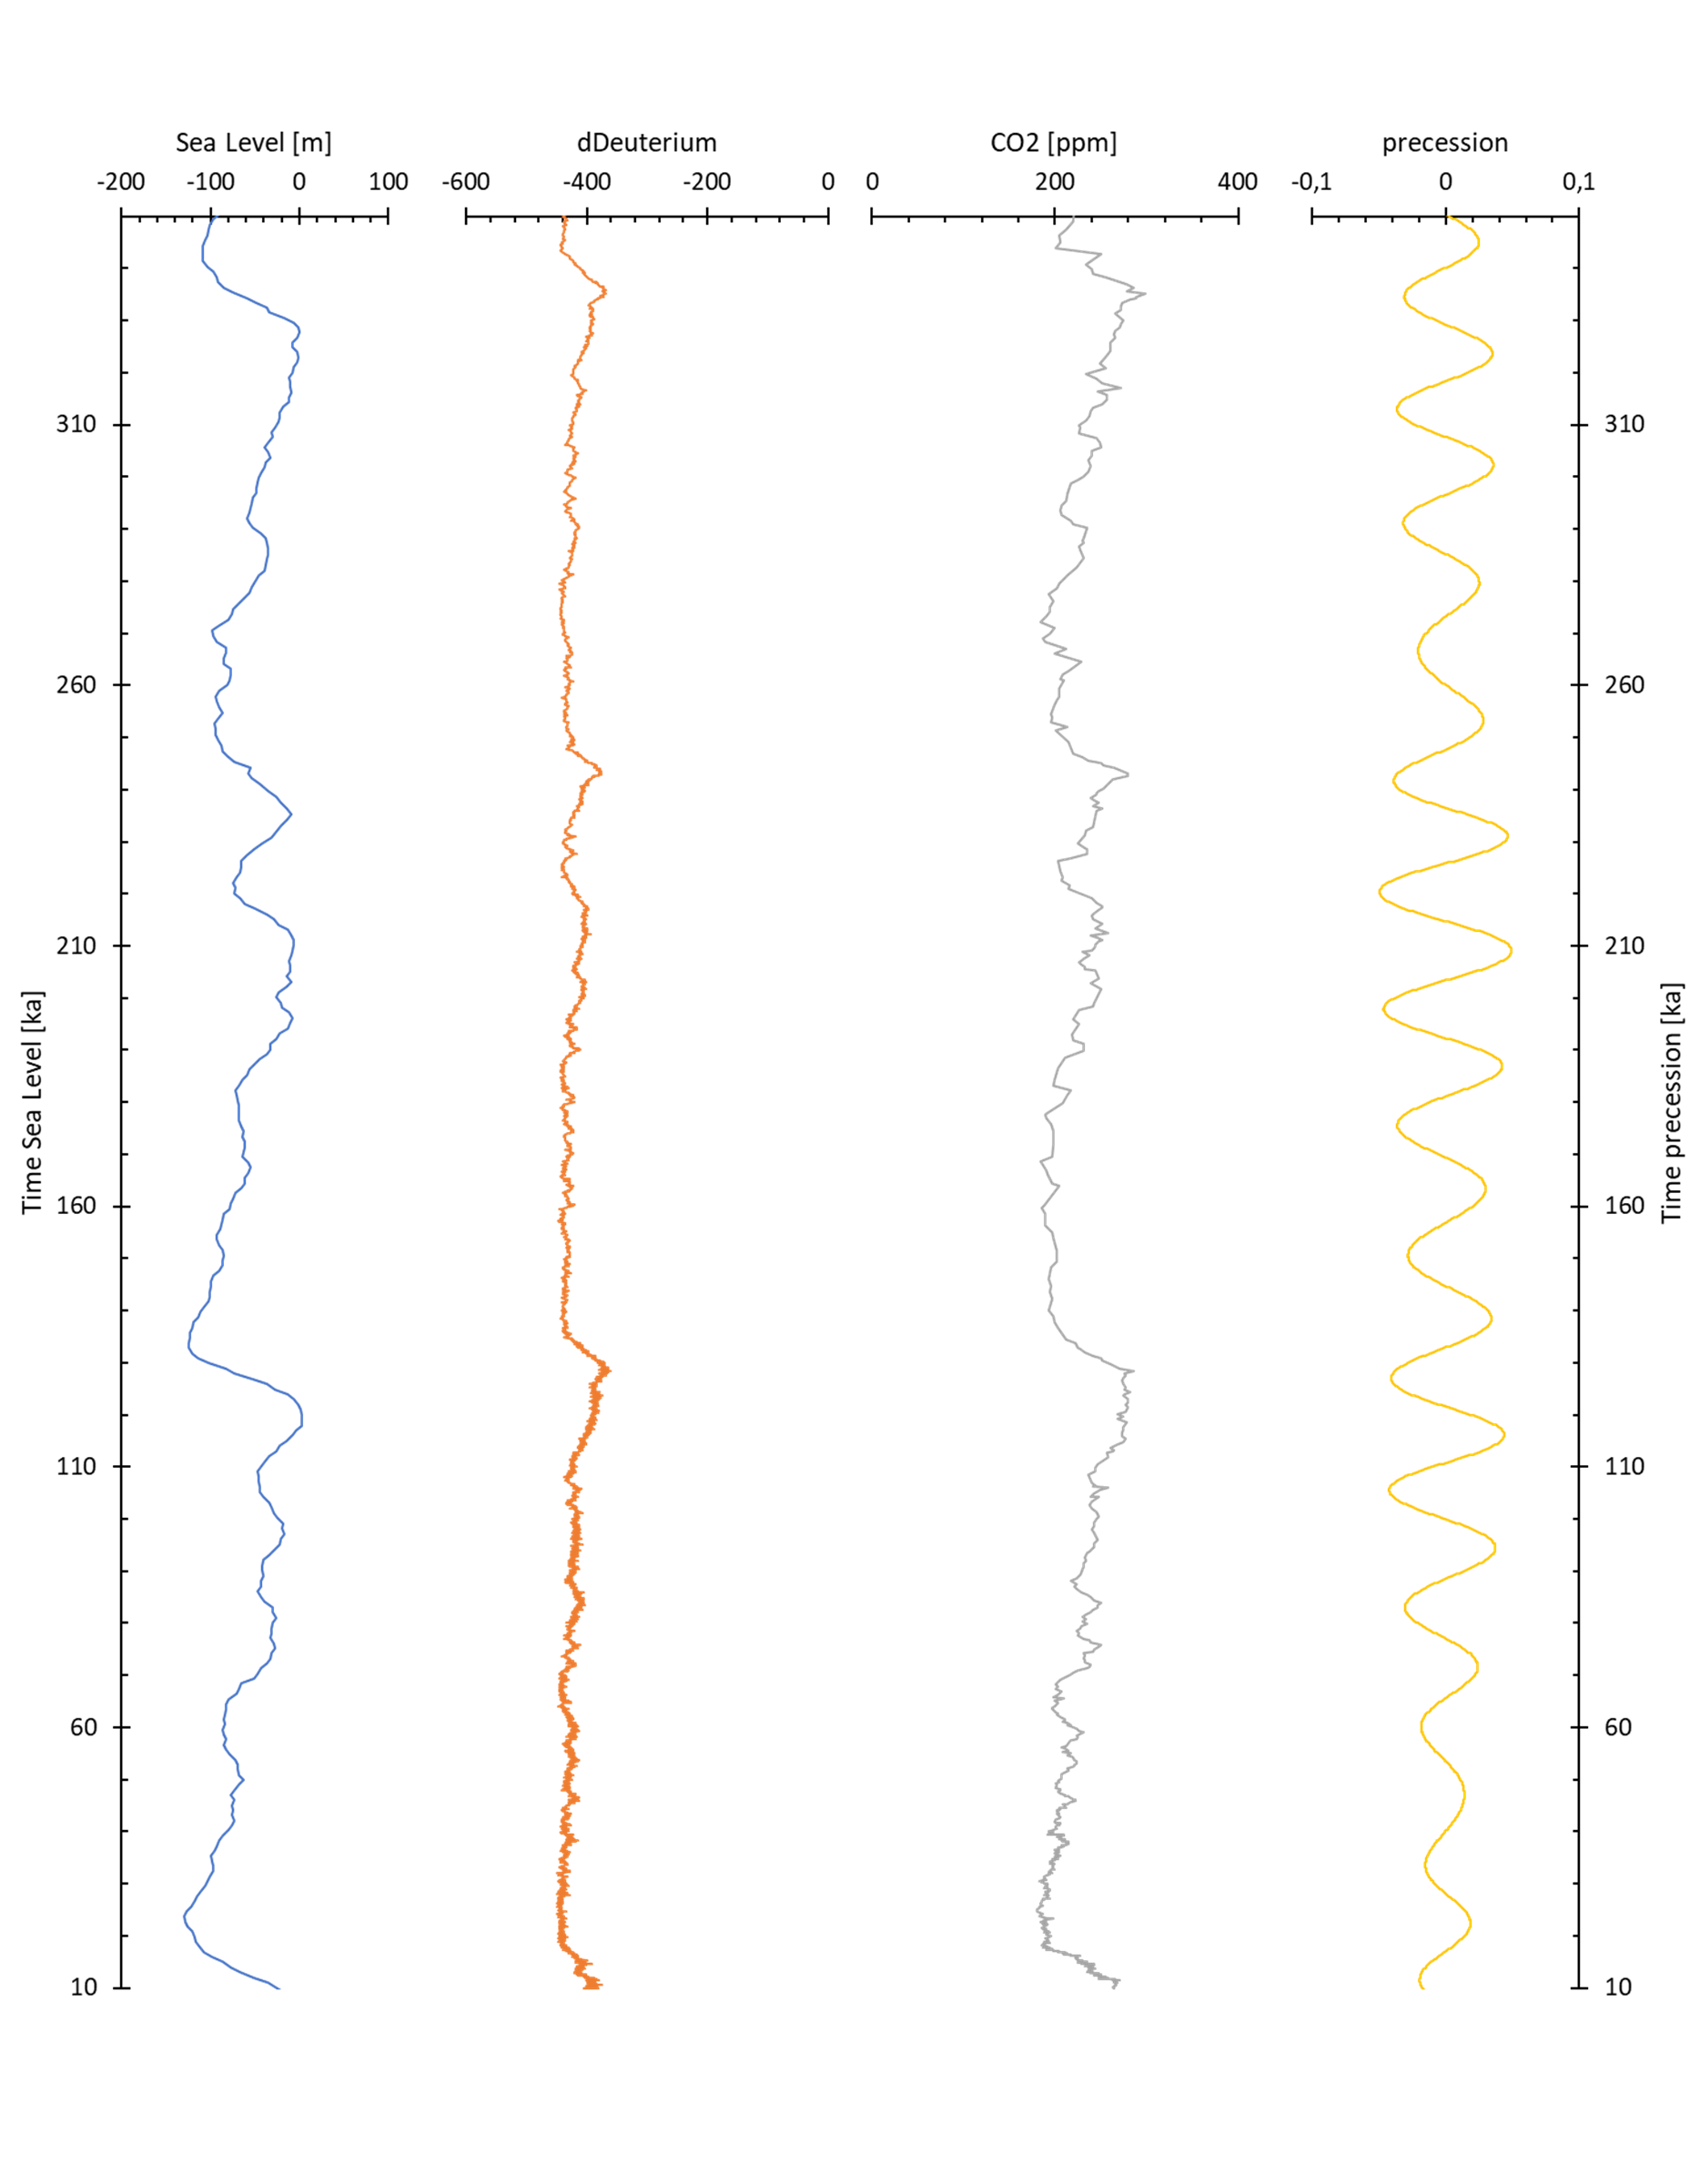
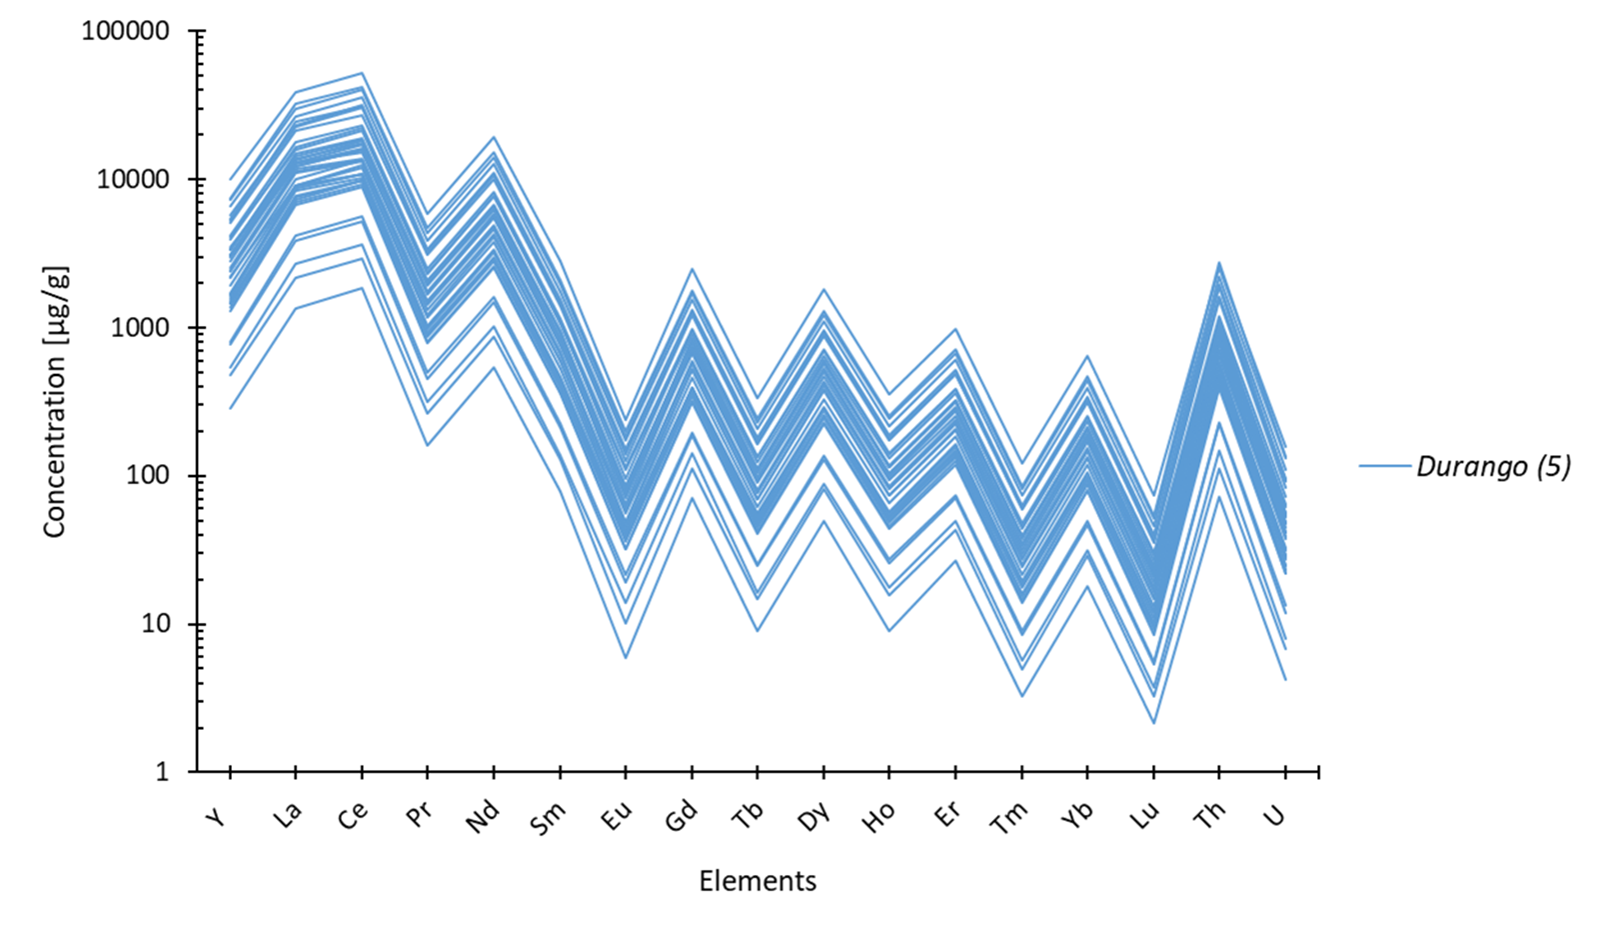
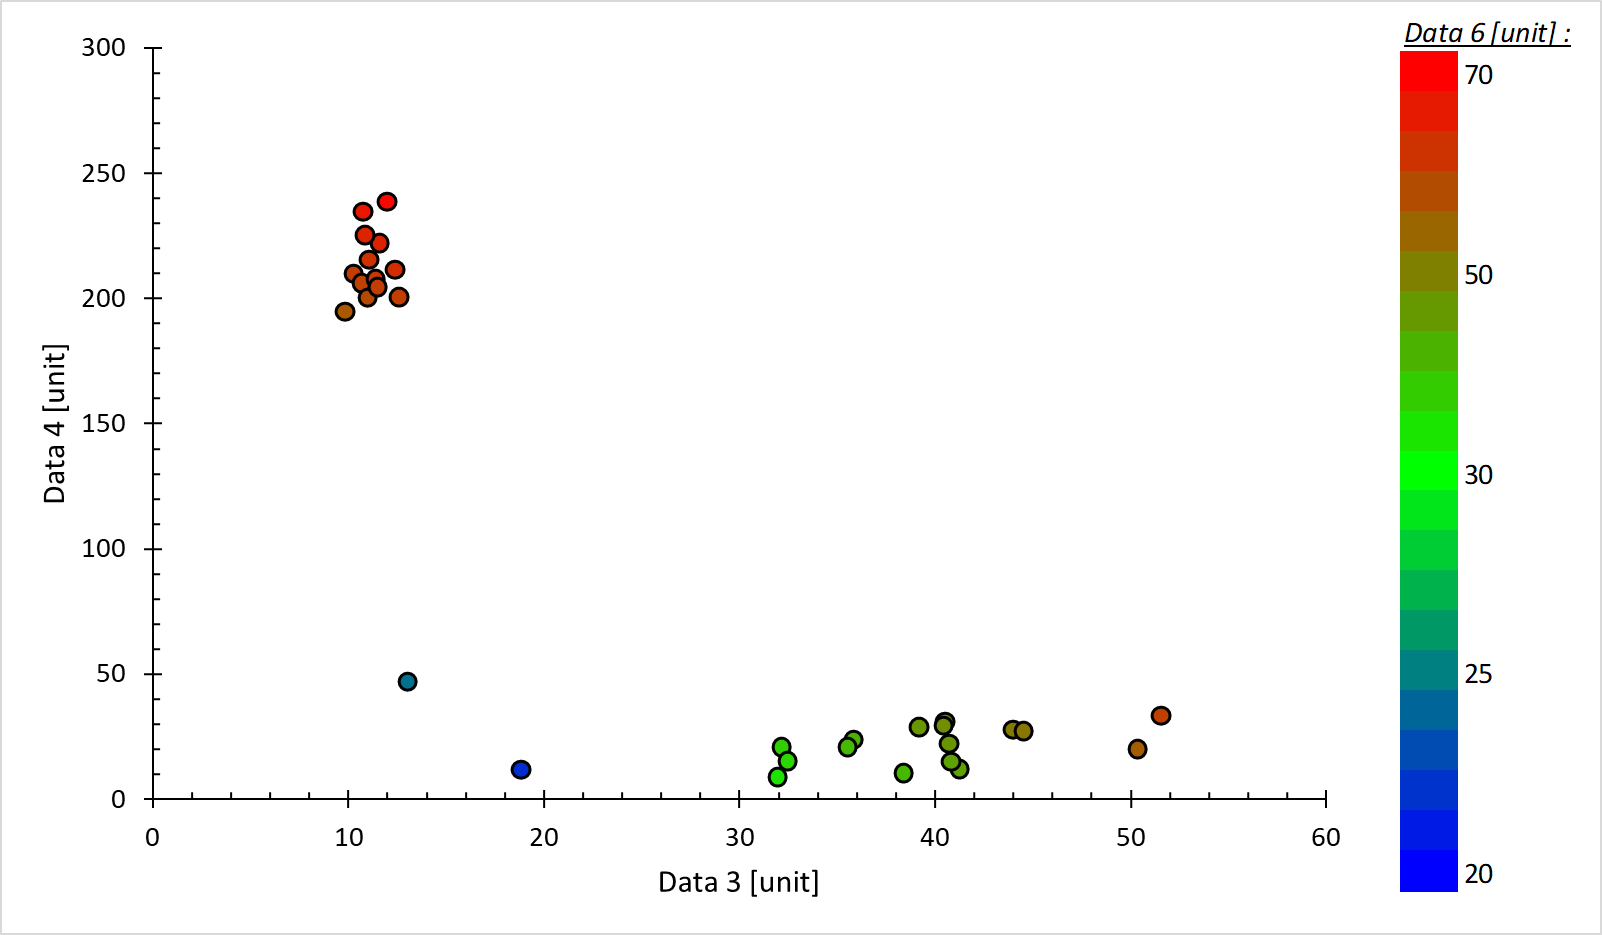
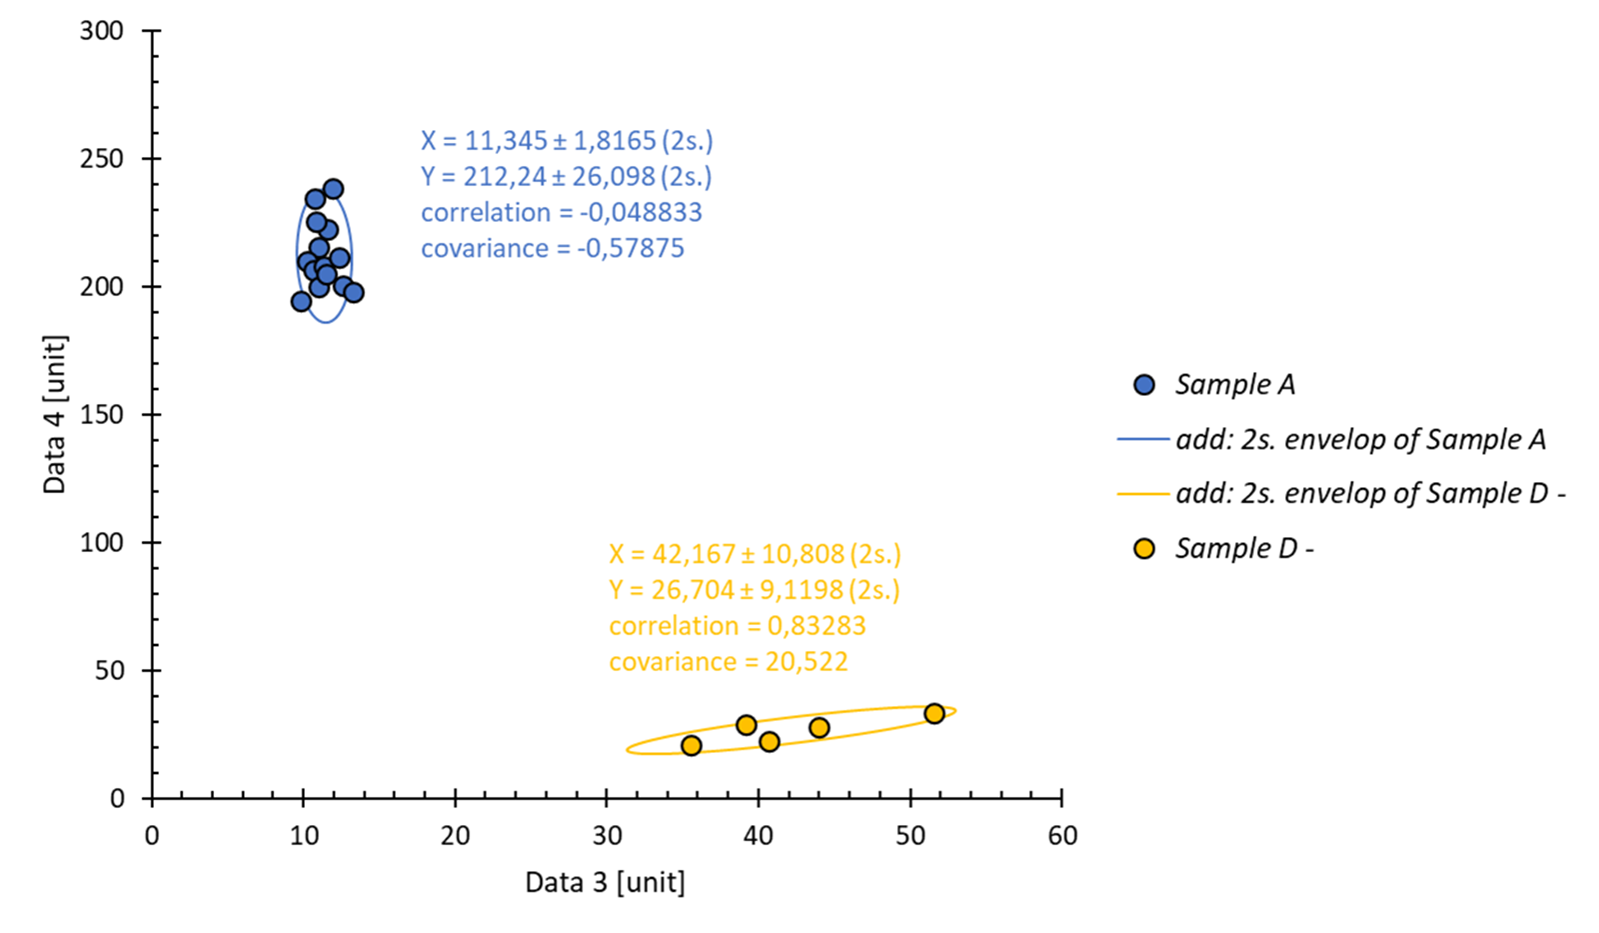
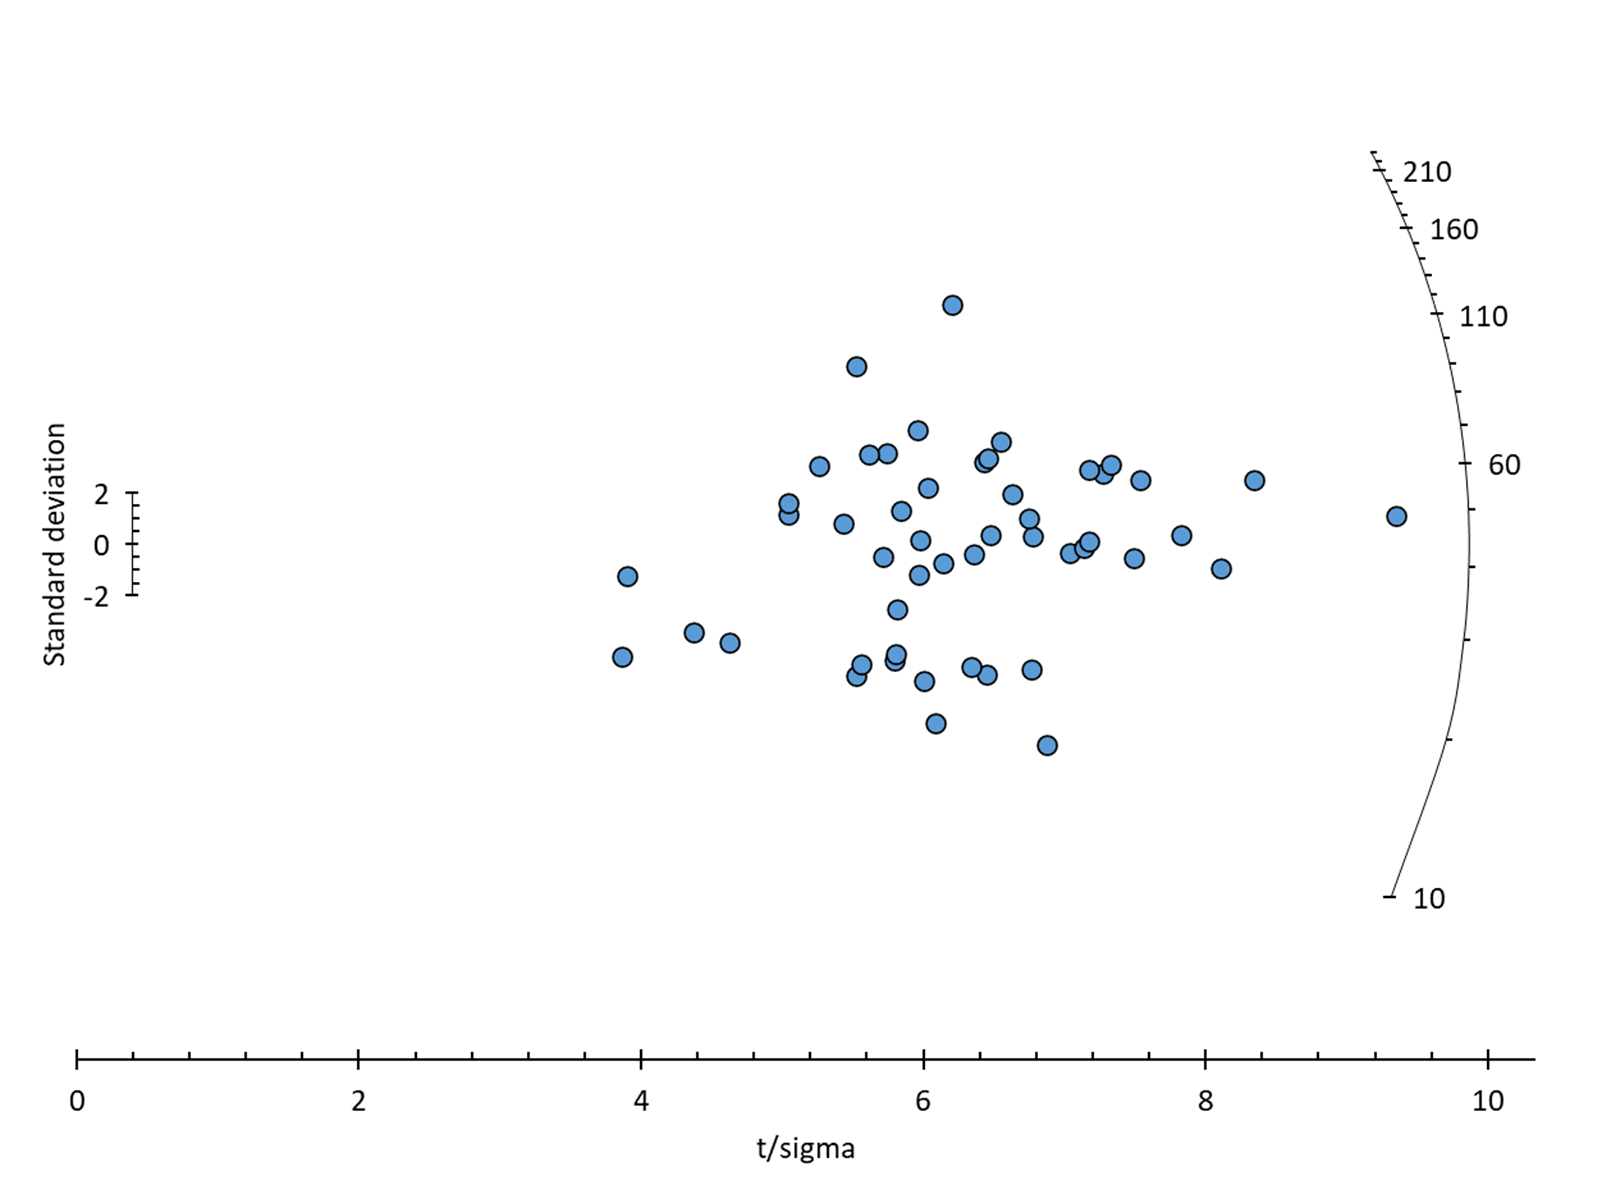
Better Plot Excel is an Excel file that contains VBA and xml code and is designed to significantly speed up the production of Excel charts and add chart types not handled natively by Excel (e.g. ternary chart, stacked ‘time’ chart, normal distribution). The file also includes geoscience-specific tools such as normalisations (chondrite, OIB, etc.) and grids (TAS, QAPF, etc.).
The basic concept behind the entire functionality is to stick as closely as possible to the interface of Excel / its classic use, and so to speak the file is thought of as an extension of Excel. All the information you need to use it can be found on this site:
- discovering and getting to grips with
- customise your series
- download
- type of charts
- customised right-click menu
- VBA structure (page being created)
If we were to look for a distant inspiration for this file, it would be Isoplot Excel, an old Excel add-on developed by K. Ludwig in the 1990s and 2000s, but which has not been maintained since. Note that its functions have since been taken over by IsoplotR develop by P. Vermeesch and this project is in no way intended to compete with that tool.
Is Better Plot Excel free?
Yes, and you can change it to suit you.
WIth which platforms can it be used on?
Excel version :
- should work on any version after Excel 2016
- never tested on a version prior to Excel 2016, but bugs are expected
- some tools may not work on the restricted version of Excel (such as the student version or the application)
Systems :
- Windows 10 (32-bit): untested, but should work
- Windows 10 (64-bit): tested and working
- Windows 11 (64-bit): untested, but should work
- MacOS (Monterey and later): tested and working for most of the main features
For MacOS users, several development features are not included in Excel for Mac, so I’m working on fixing the bugs and getting all the features to work… but that takes time.
Here is the list of known problems: saving as .pdf impossible (but saving as .svg available), exporting as .ppt (natively impossible for the moment).
Origin of the project :
2017-2021: self-taught learning of VBA in the context of analytical data processing problems during my thesis in geosciences (geochemistry – geochronology).
2020-2021: The idea for this project came to me at the end of my thesis, during which I needed a tool to simplify/accelerate the representation of data in order to save time for the rest of my scientific research. Covid gave me the opportunity to lay the foundations of this tool for personal use.
Since then, I’ve continued to add features as my research needs have changed.
2023: following an idea that was already there at the start of the project, and thanks to requests from colleagues, I produced a first ‘user’ version, then distributed it on GitHub.
Since then, I’ve been adding features as and when I’m asked to, because the structure of the code now makes it possible to add features in a relatively short space of time.
2024: migration of documentation from GitHub to this site to make it more readable.
How to thank / contribute to the project :
There is currently no scientific publication that can be cited to reference this work, so I’m just asking you to mention this site and its author.
If you’d like to contribute, please don’t hesitate to contact me directly, whether to report bugs, request features or add code yourself.
