
can be performed on data that is already represented in a graph and can be accessed by RIGHT-CLICKing on it:
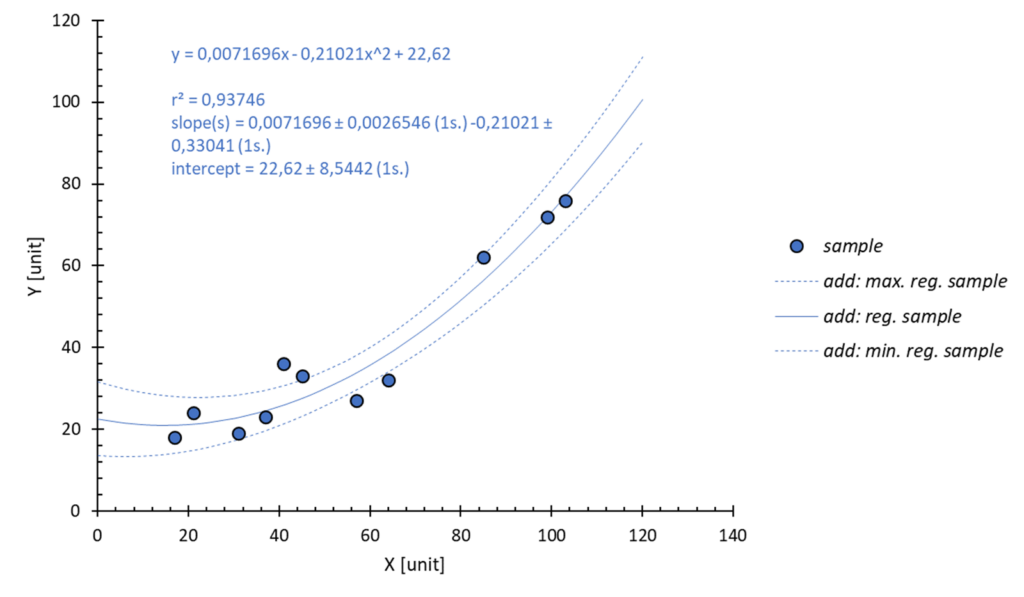
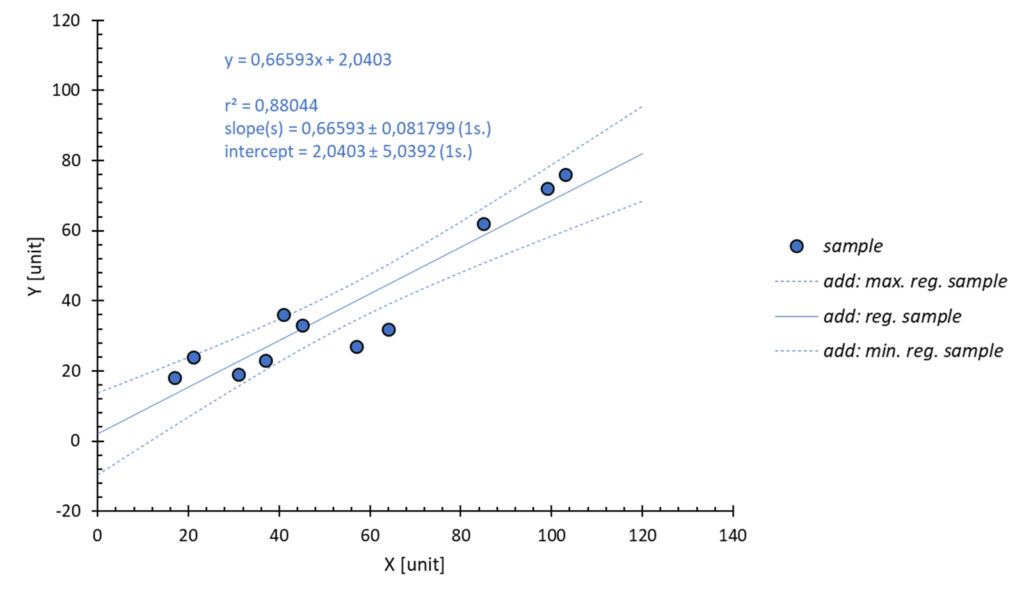
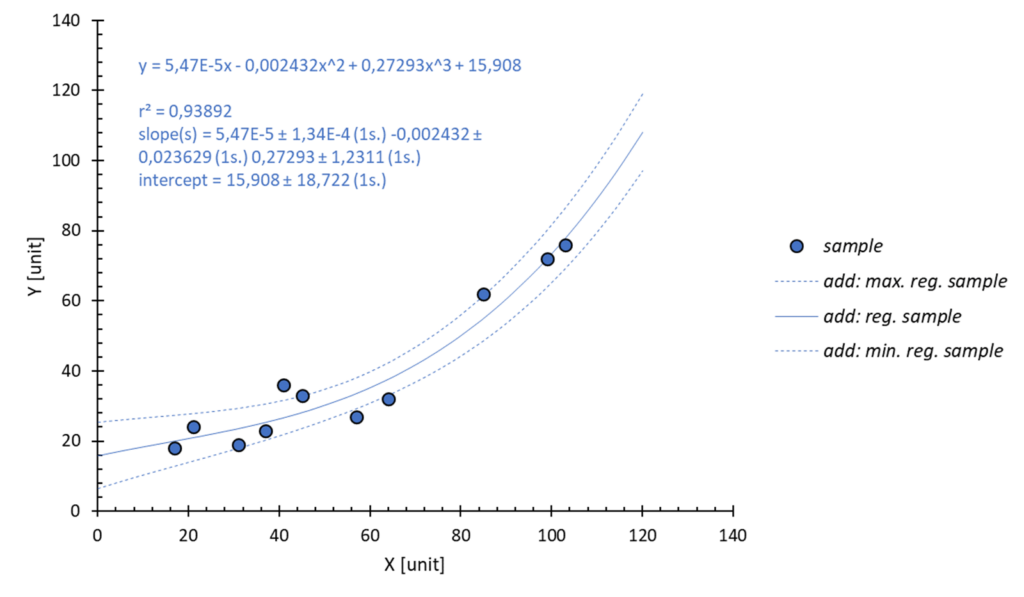
- mathematical regression + prediction envelope (XY chart and equivalent)
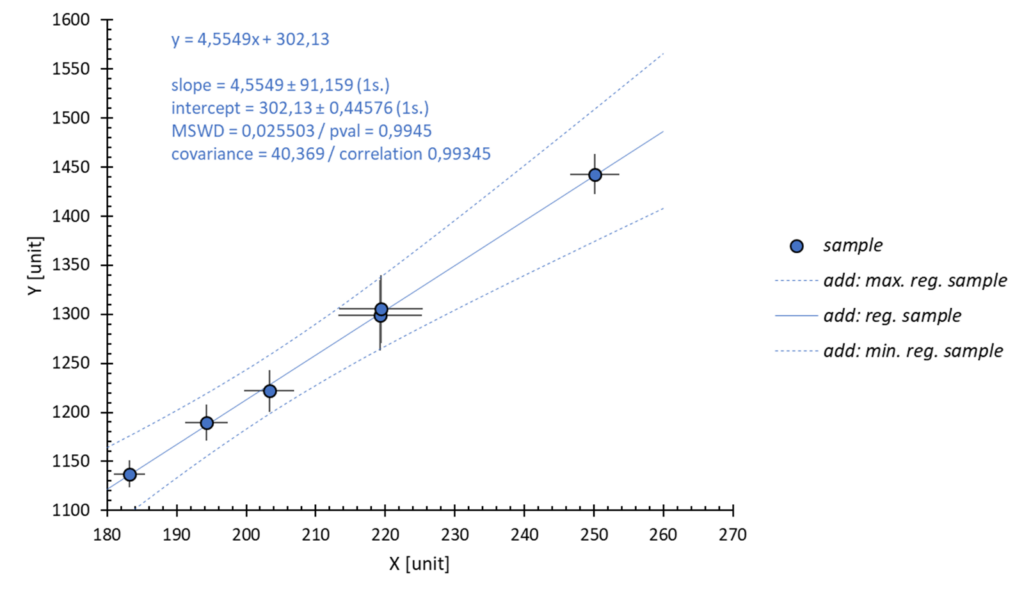
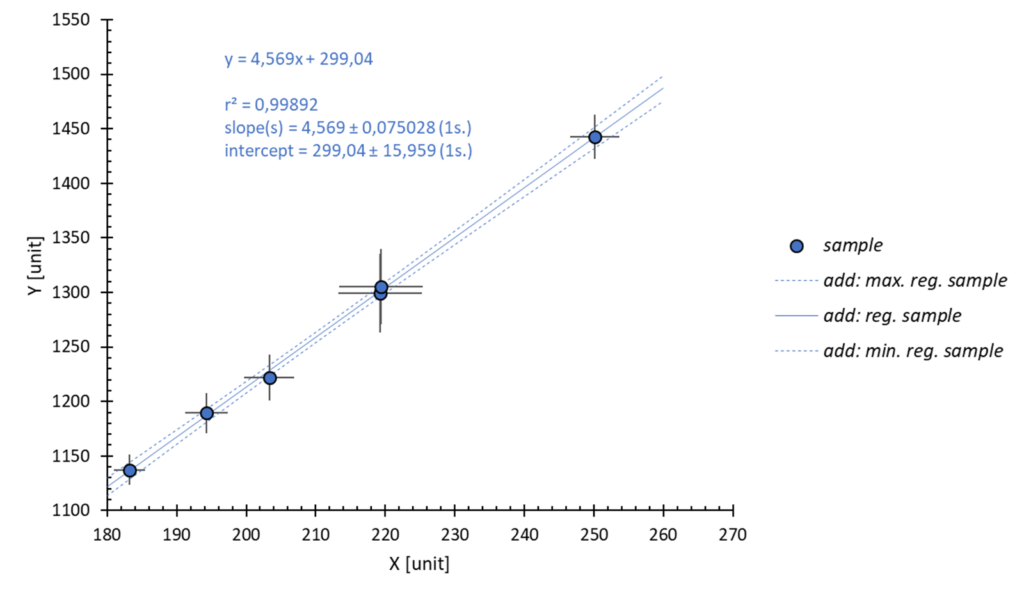
- linear regression taking into account individual errors (XY chart)
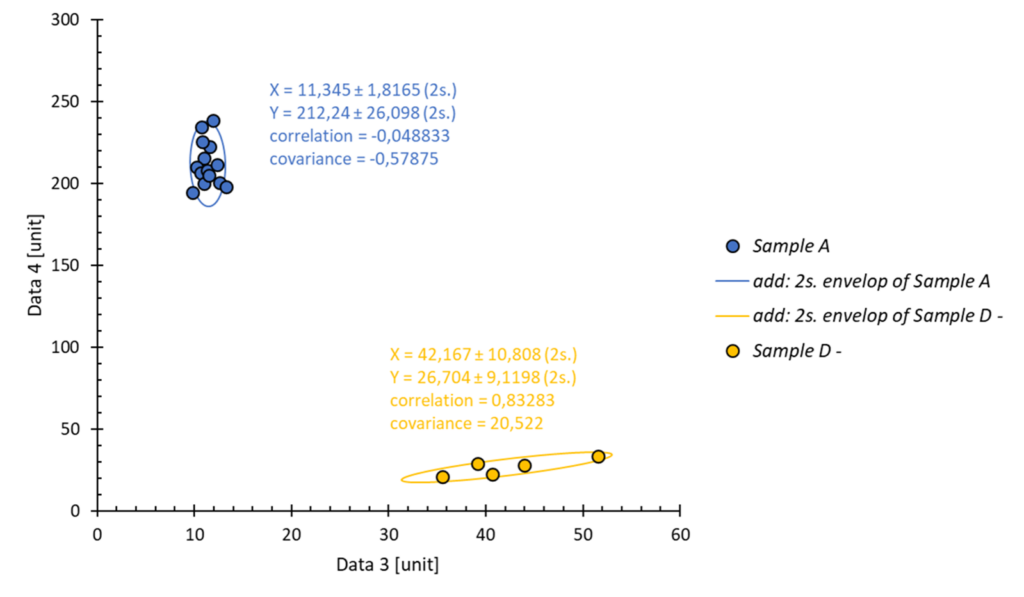
- confidence ellipsoid (XY chart and equivalent)
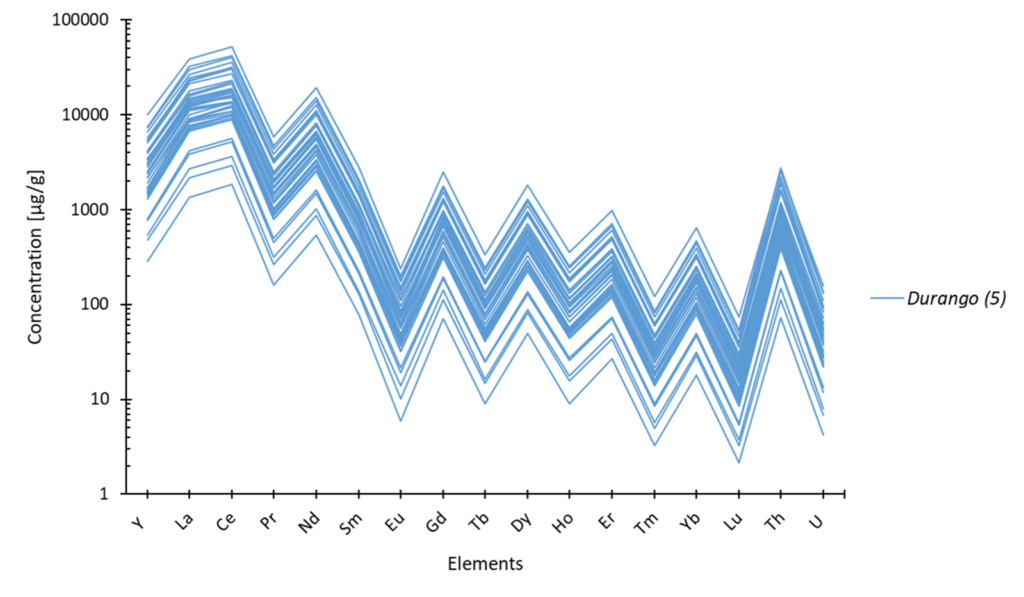
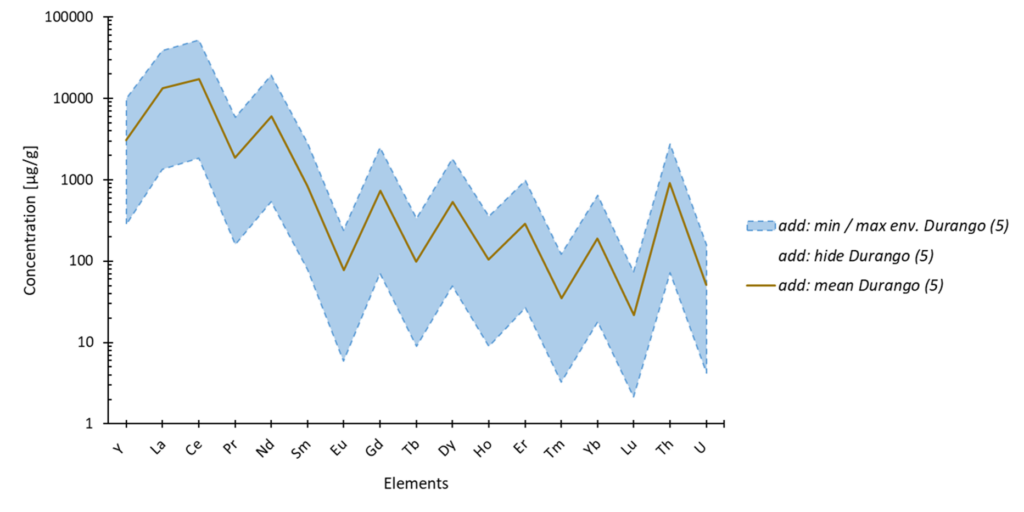
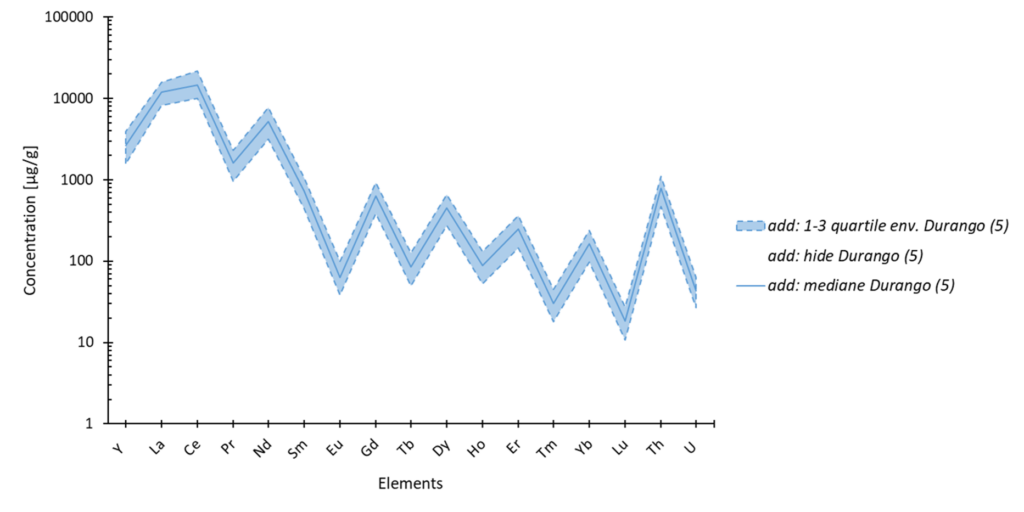
- minimum, maximum et mean (Y chart – spider diagram)
- 1ᵉʳ and 3ᵉ quartile, median (Y chart – spider diagram)
- moving average (XY graph – stacked)
- data copy
Classical mathematical regression :
Options :
- data: X and Y
- type available: linear, polynomial, exponential, logarithmic
- statistical calculation :
Linear regression including errors :

Options:
- data: X, Y, dX and dY
- type available : linear
- statistical calculation :
Confidence ellipsoid :

Options :
- data: X and Y
- statistical calculation :
Minimum, Maximum et Mean:
Options :
- data: Y
- statistical calculation :
1ᵉʳ quartile, 3ᵉ quartile and median:
Options :
- data: Y
- statistical calculation :
Moving average :

Options :
- data: X and Y
- statistical calculation :
Copy of data :
This action copies all the data in the series to your clipboard according to the structure: 1ʳᵉ column = data X, 2ᵉ column = data Y
Options :
- regression: if you perform this action on a series resulting from a regression that includes an envelope, the copy will include the predicted values as well as the positive and negative values of this envelope.
