
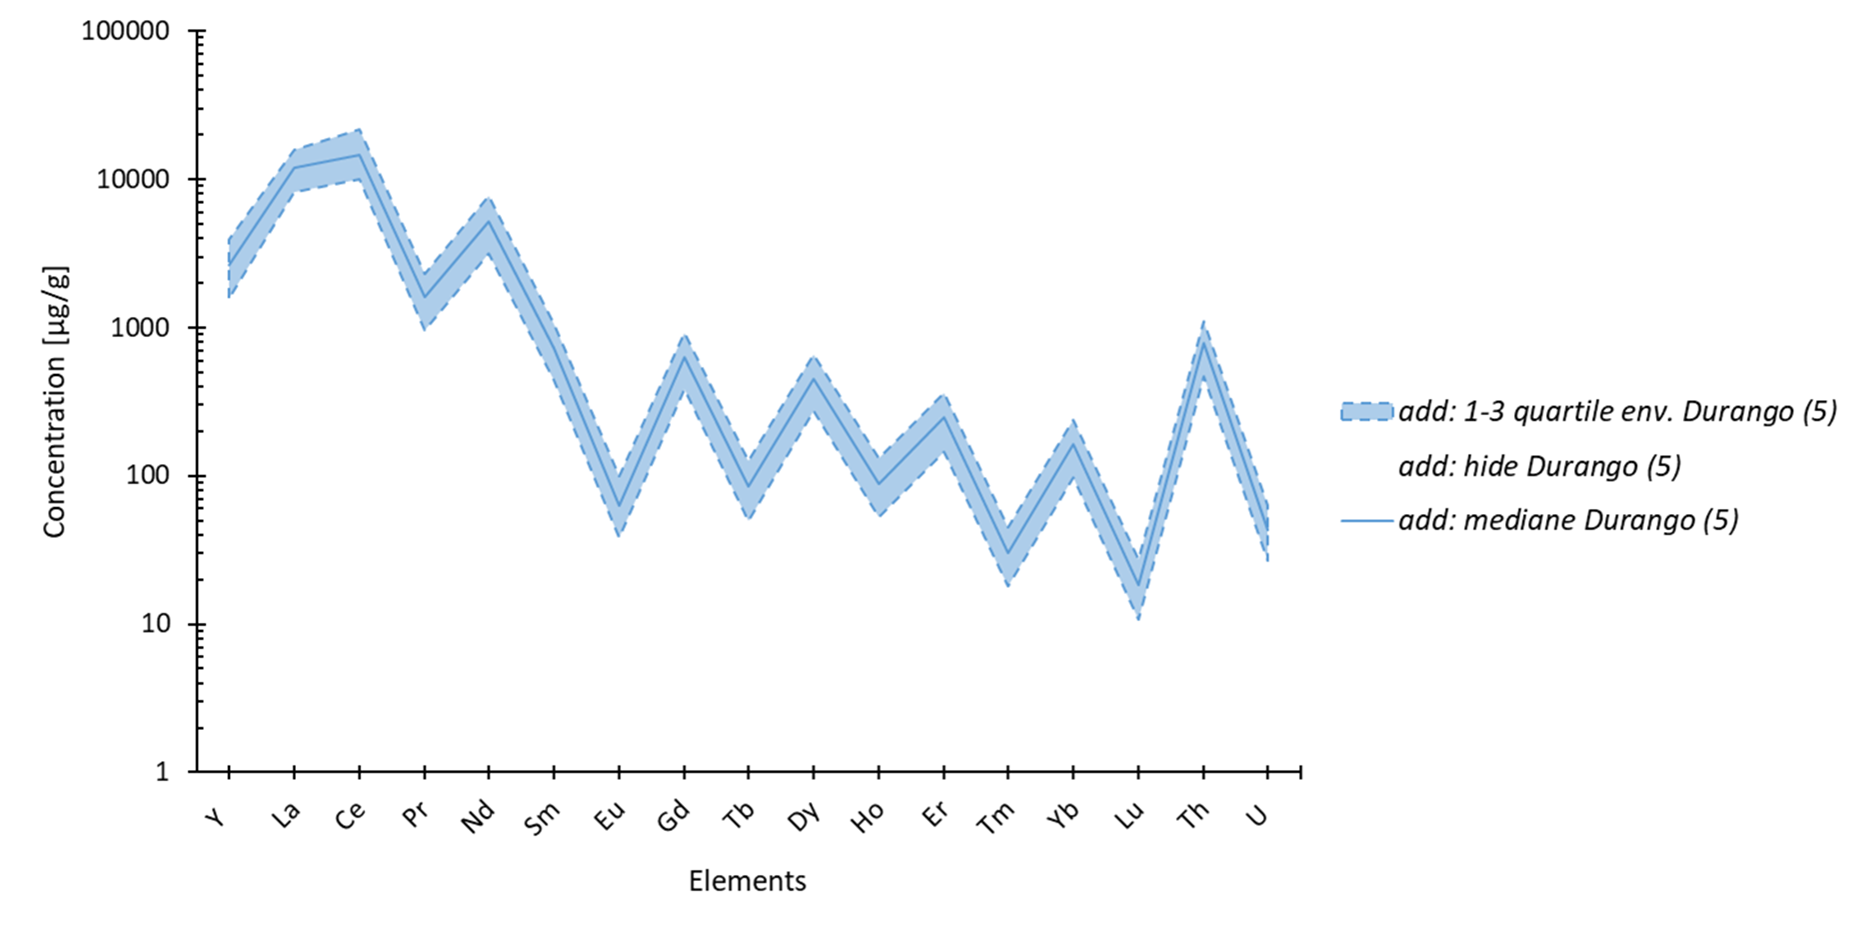
can be created from a selected data set, with an example of the result obtained (see the tutorial on creating statistical graphs). Note that some of these graphs come with a window for entering processing parameters.
- calculation of a normal distribution/law
- calculation of a weighted average
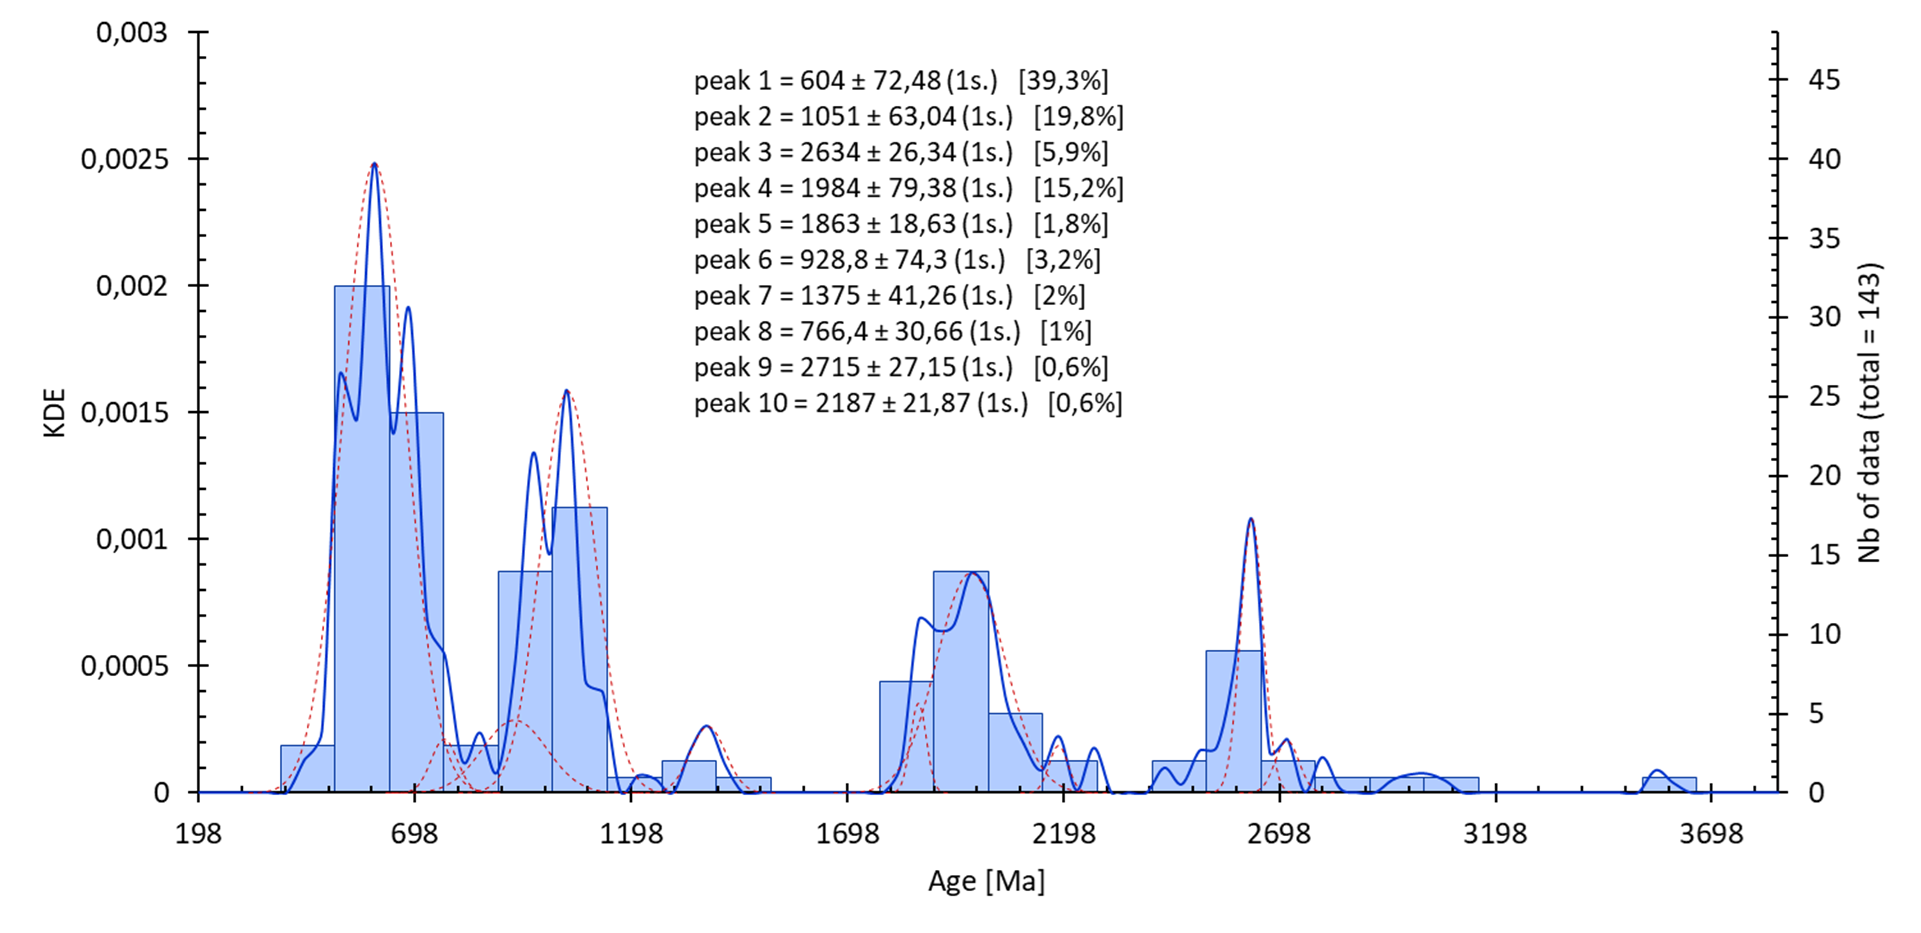
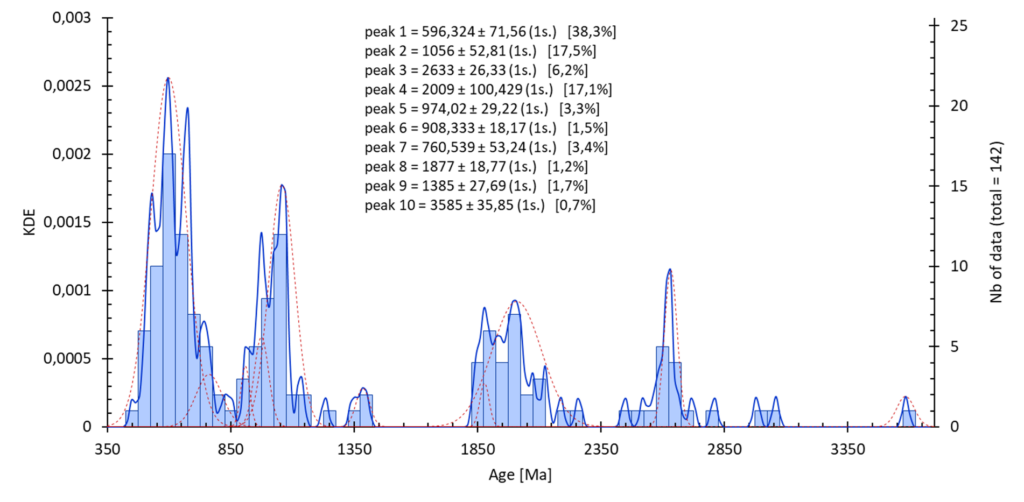
- calculating a KDE
- population calculation/display
- display a radial/Galbraith plot
Selecting statistical data :
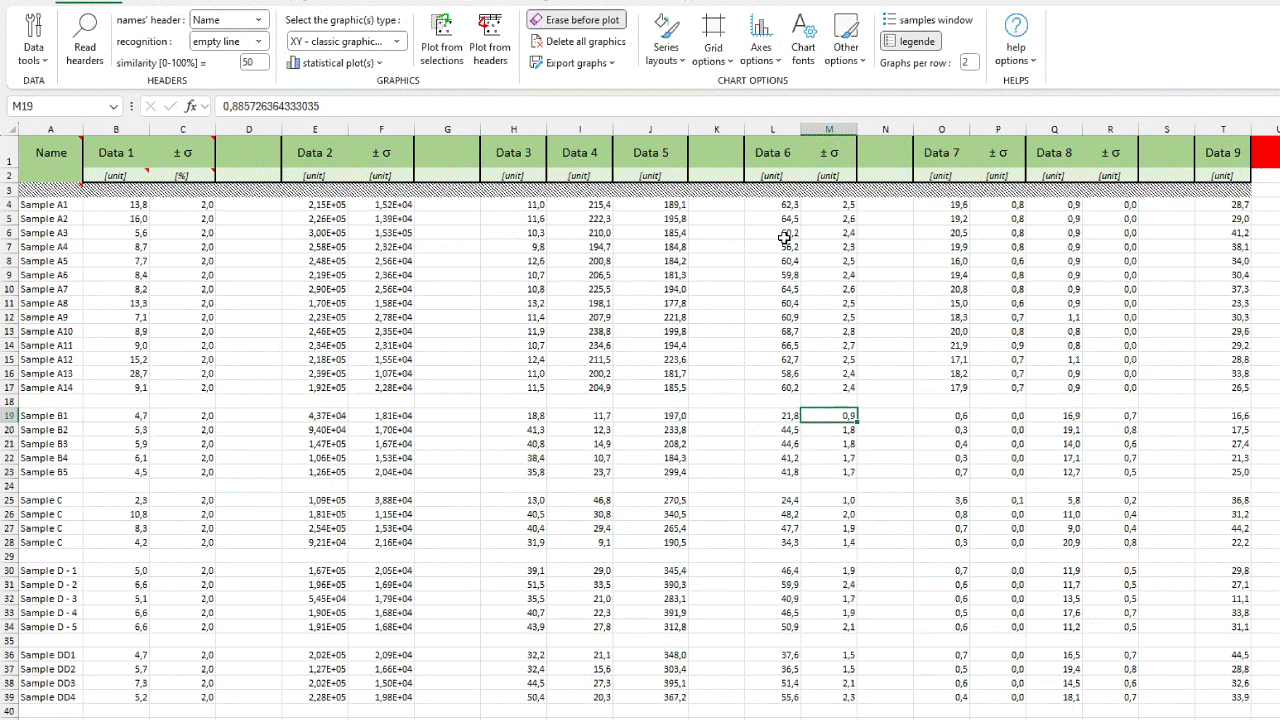
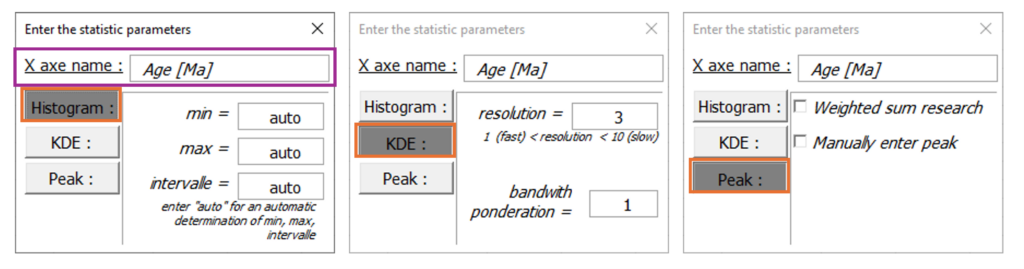
“X axis name”: name of the X axis (stored by Better Plot)
“Histogram”: parameters governing the construction of histograms
- min: low value of the minimum interval
- max: high value of the maximum interval
- interval: range of intervals for each bar in the histogram
“KDE”: parameters for calculating the KDE curve
- resolution: defines the number of points in the KDE curve for a histogram bar. Increasing the resolution refines the curve, but takes longer to calculate.
- bandwith weighteration: used to modulate the flattening rate of the KDE curve (basic value is 1).
“Peak”: parameters controlling the search for peaks in KDE
- weighted sum research: performs a weighting when searching for peaks. Can be useful for very similar populations.
- manually enter peak: allows you to enter populations yourself (already defined via other software, see the definition section).
Distribution / normal distribution :
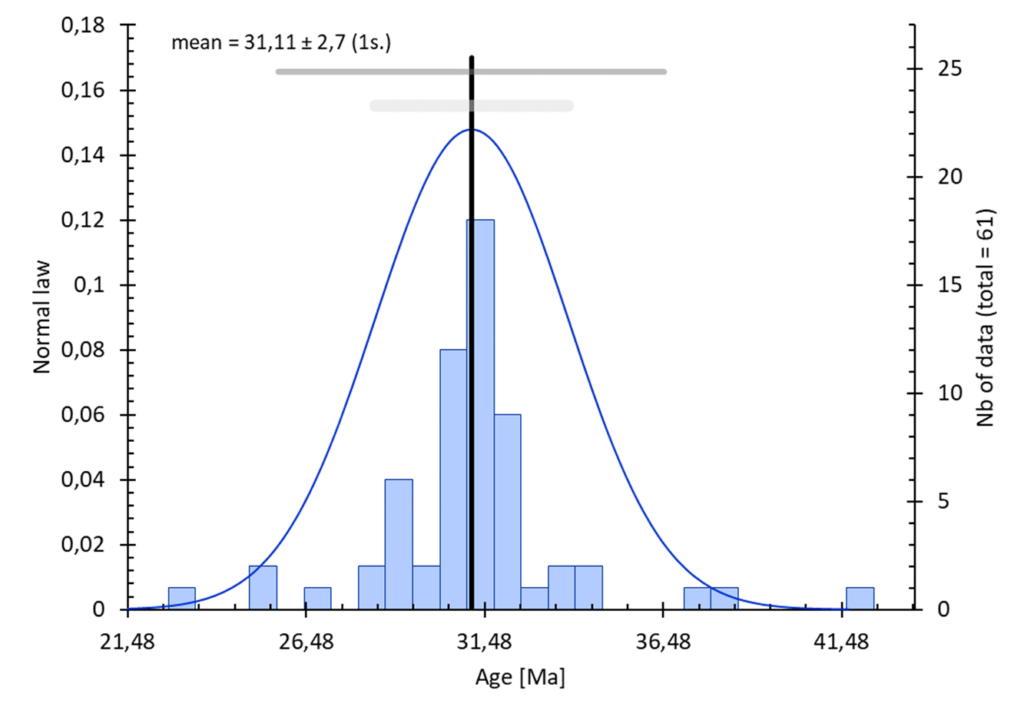
Options :
- selection: 1ʳᵉ column = data, 2ᵉ columns (optional) = uncertainty (1 sigma)
- uncertainty: taking account of uncertainties in the data set if available
- interval: you can select the parameters for constructing the histogram. See help on entering statistical data.
- statistical calculation :
blablablalblalblalbalb
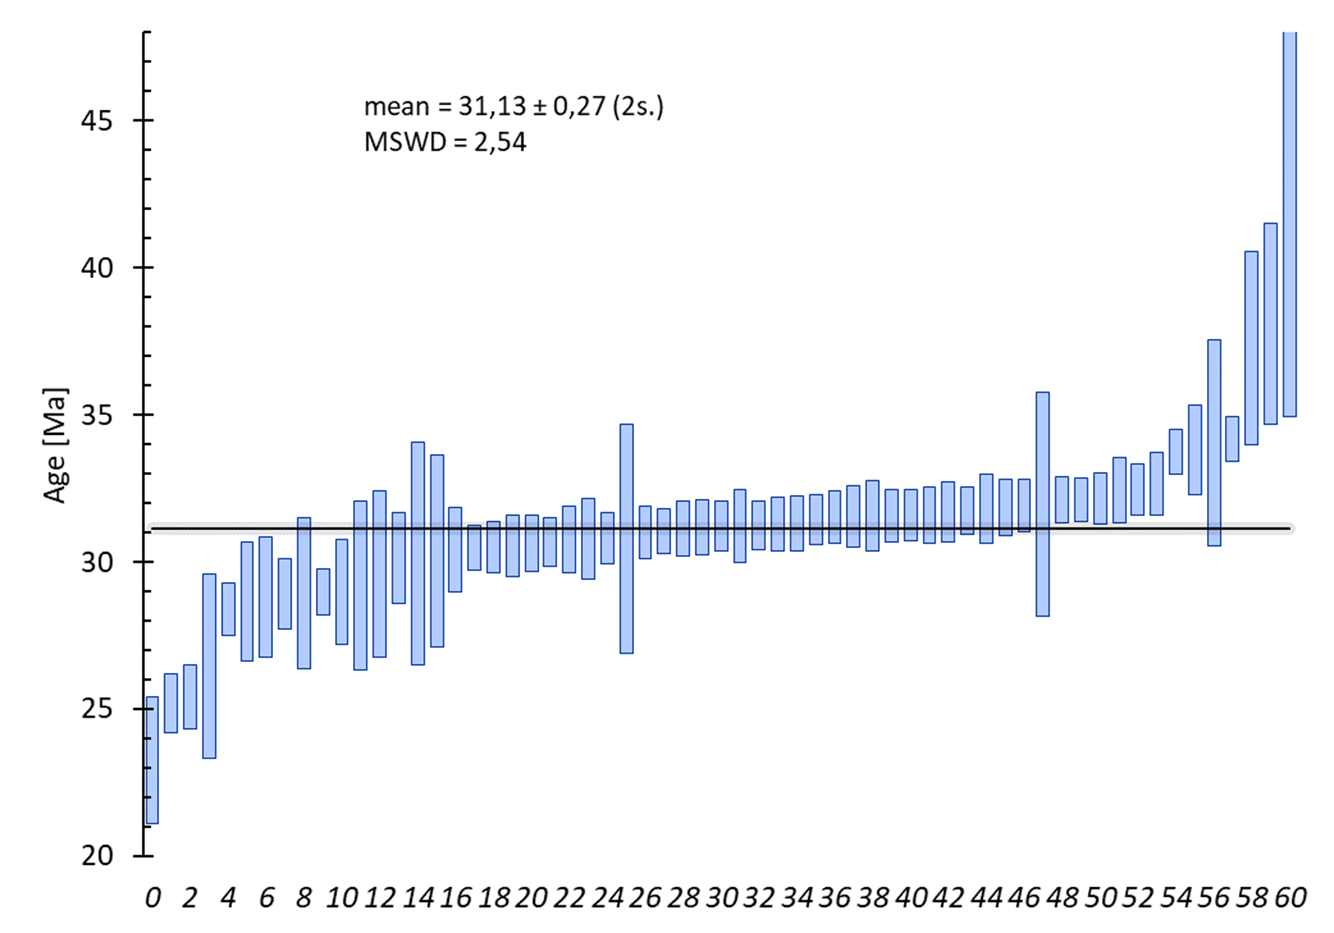
Weighted average :

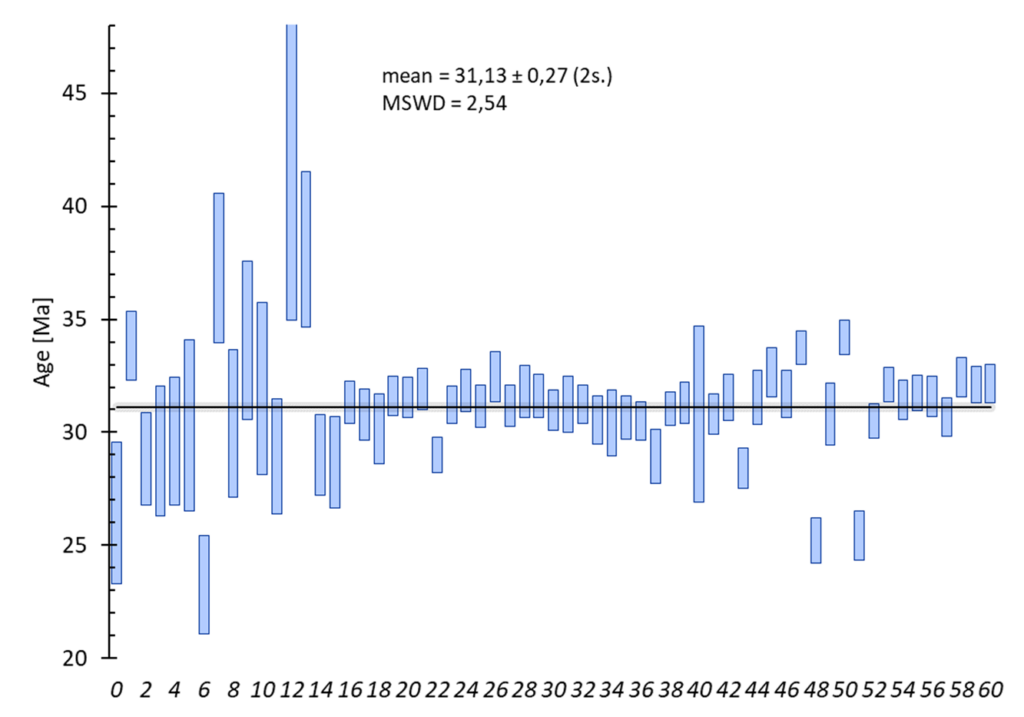
Options :
- selection: 1ʳᵉ column = data, 2ᵉ columns = uncertainty (1 sigma)
- data sorting: data can be sorted in ascending order. See help on entering statistical data.
- statistical calculation :
blablablalblalblalbalb
Calculation of a KDE (kernel estimation) :
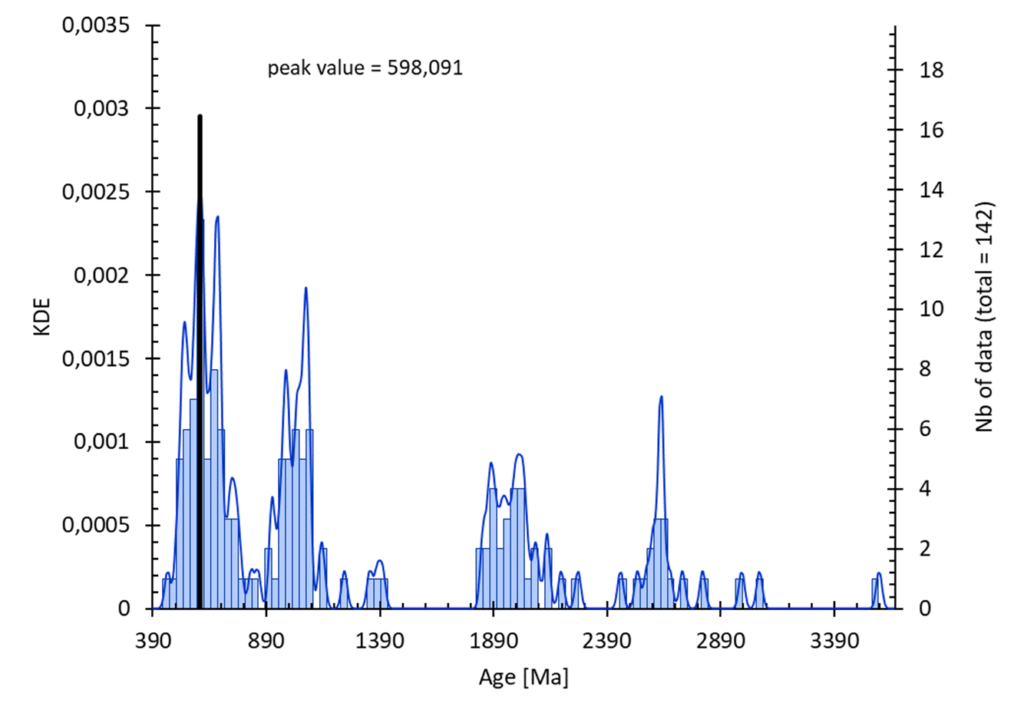
Options :
- selection: 1ʳᵉ column = data, 2ᵉ columns (optional) = uncertainty (1 sigma)
- uncertainty: taking account of uncertainties in the data set if available
- interval: you can select the parameters for constructing the histogram. See help on entering statistical data.
- statistical calculation :
Calculating or representing populations :

Options :
- selection: 1ʳᵉ column = data, 2ᵉ columns (optional) = uncertainty (1 sigma)
- uncertainty: taking account of uncertainties in the data set if available
- interval: you can select the parameters for constructing the histogram. See help on entering statistical data.
- population: population data can be entered (mean + 1 sigma) or estimated from the data set.
- statistical calculation :
Representation of a radial / Galbraith plot :
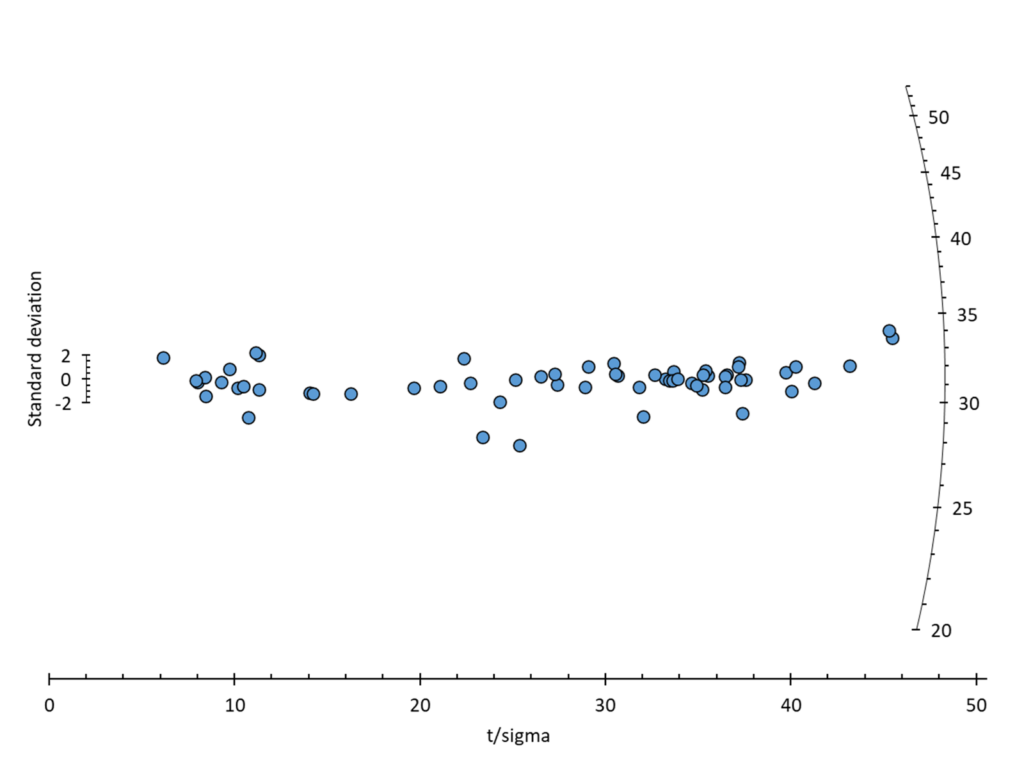
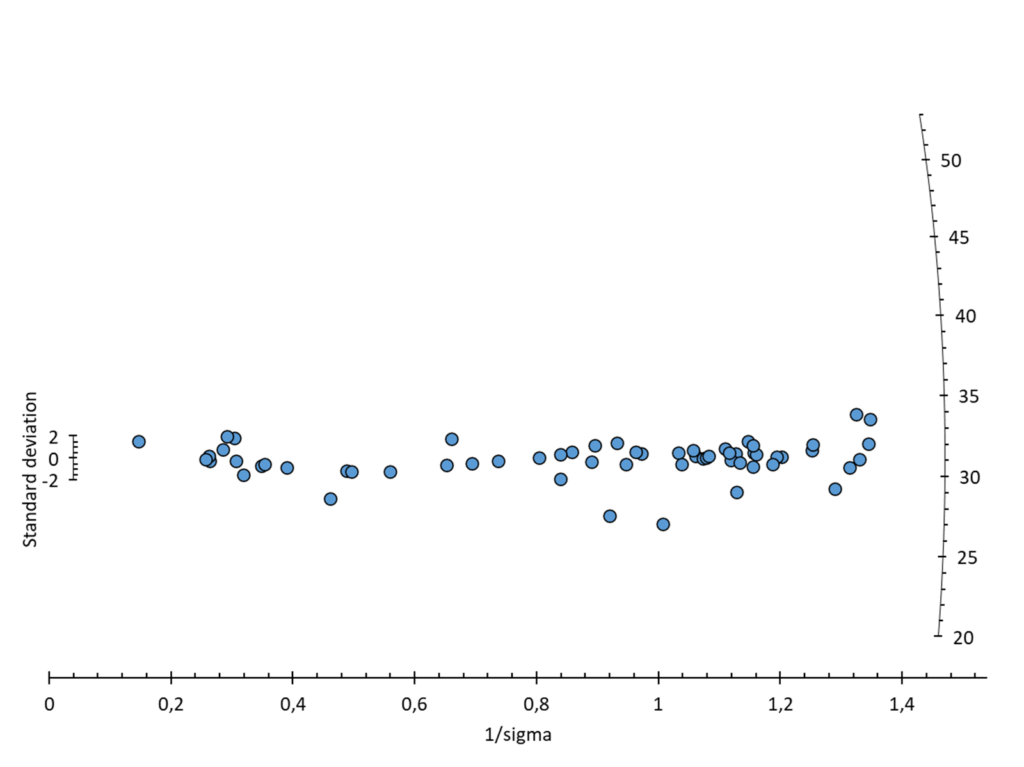

Options :
- selection: 1ʳᵉ column = data, 2ᵉ columns = uncertainty (1 sigma)
- projection: it is possible to select between a linear or logarithmic projection of the radial axis
- statistical calculation :