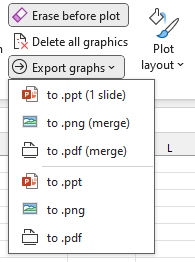


Files can be exported via the ‘Export graphs’ menu, which offers several export formats, each with its own advantages:
In addition to the choice of format, there are two main export options:
- merge: exports all the graphs as a SINGLE FIGURE using the current layout of the graphs. The choice of destination / figure name is made via a standard save window.
- simple: export each graph individually into a figure, generating as many figures as there are graphs. The destination for the figures is selected via a standard save window (by selecting a destination folder), and the figures are automatically named after the axes of the graphs.
Export in .ppt format:
This format will create a new PowerPoint document and insert all the graphics depending on whether you want 1 graphic per slide (“classic”) or a single slide with all the graphics.
This option allows you to quickly generate discussion and/or data exchange documents while retaining the interactivity of Microsoft Office suite graphics.
This option requires PowerPoint to be installed and is available on macOS and Windows.
Export in .png format:
The default format is .png, but other formats may be available on request (.jpeg, .gif, .tif, ….). The export resolution is optimised for legibility of graphics the size of those generated automatically.
This option is available on macOS and Windows.
Export in .pdf format:
This export allows you to save graphics in vector format. The format chosen is .pdf due to its widespread use, but other formats (.svg) are potentially available on request.
This option is designed to simplify the editing of graphics with vector editing software (Inkscape, Illustrator, etc.).
This option is not available on macOS due to restrictions on the VBA code under this OS. However, you can always export the file manually (right-click > save as image).
Export to print:
This export option copy all your charts to a new Excel “sheet” and ensures that they fit the selected format (portrait or landscape) so that they can be printed directly from Excel (File > Print). The print settings for this page are automatically adjusted to maximise the print area.
Note: each time you export, a new “sheet” is created, so this option can also be used to store different graphs.
