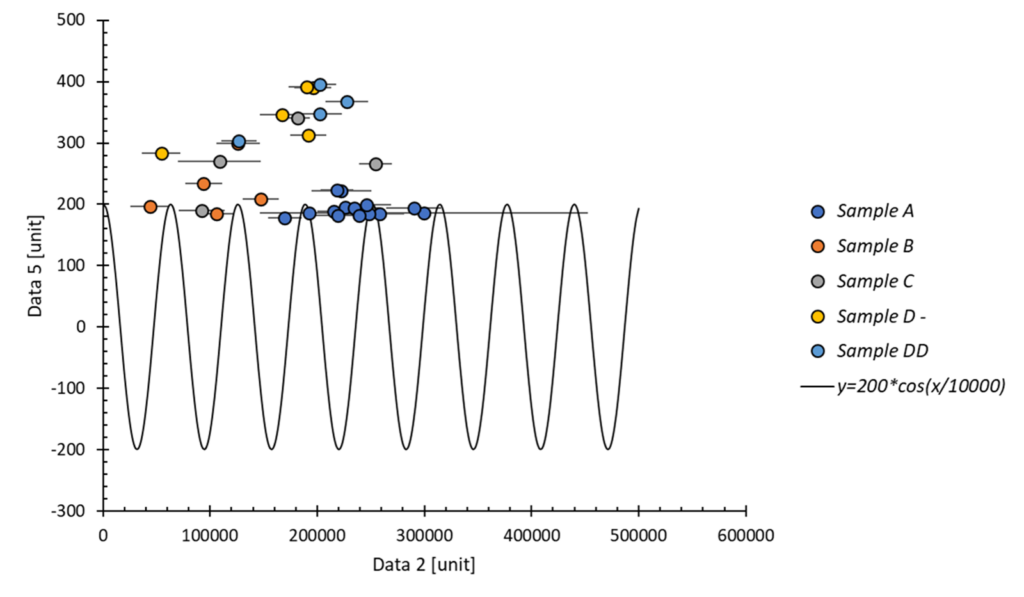
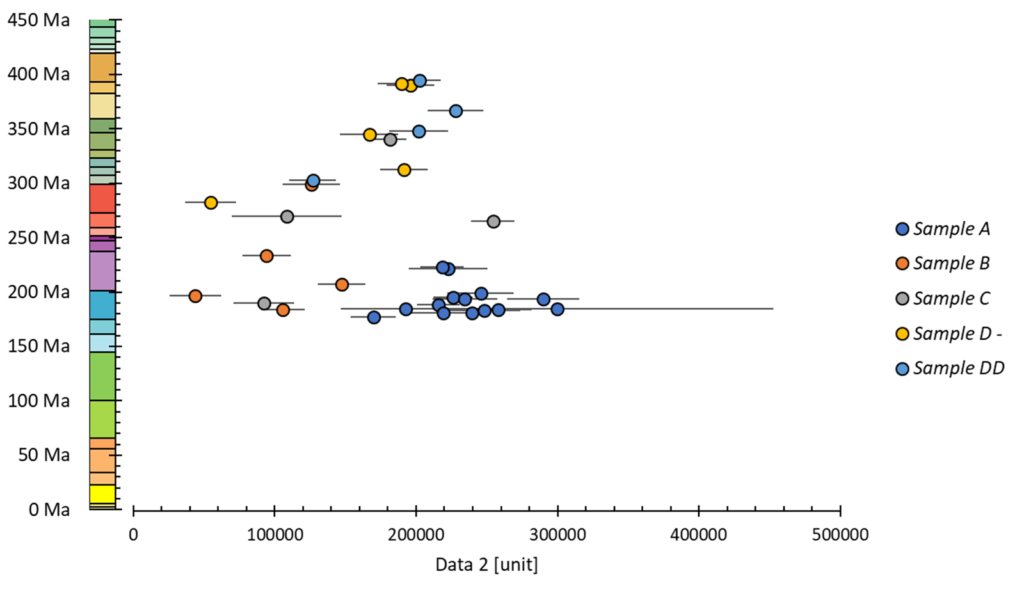
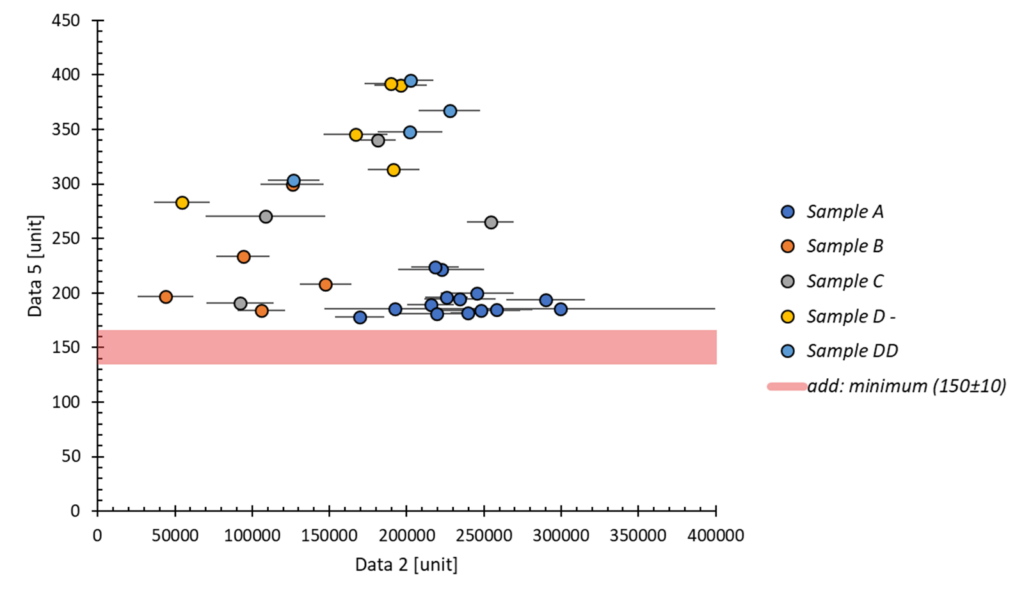
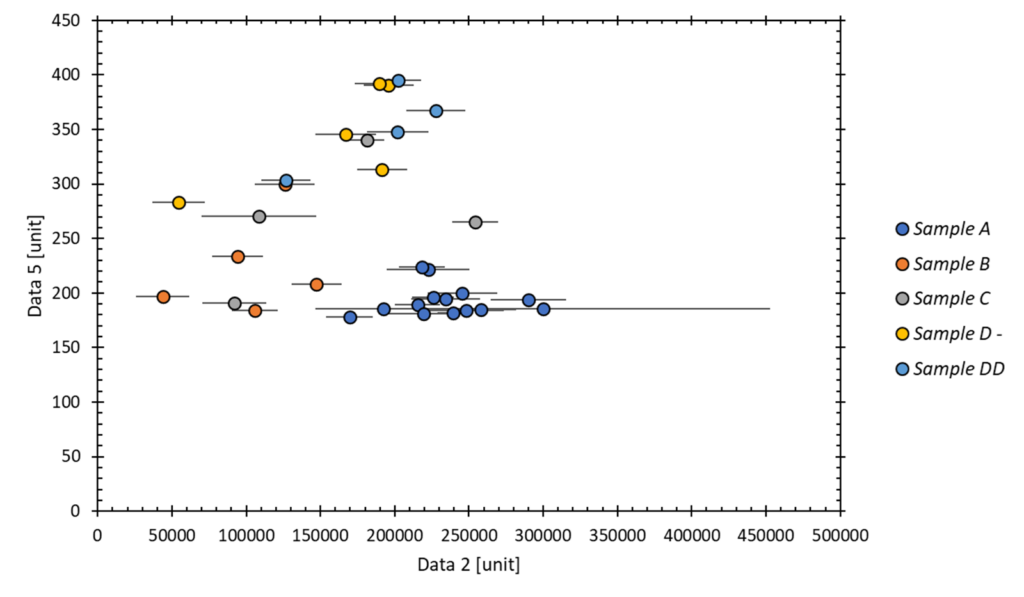
This can be done on charts already created and can be accessed via the RIGHT-CLICK menu at different points on the chart.
- add a constant (right-click – axis)
- add a function (right-click – plot area)
- framing the axes (right-click – plot area)
- replace an axis with a custom timescale (right-click – axis)
Adding a constant on the X or Y axis :
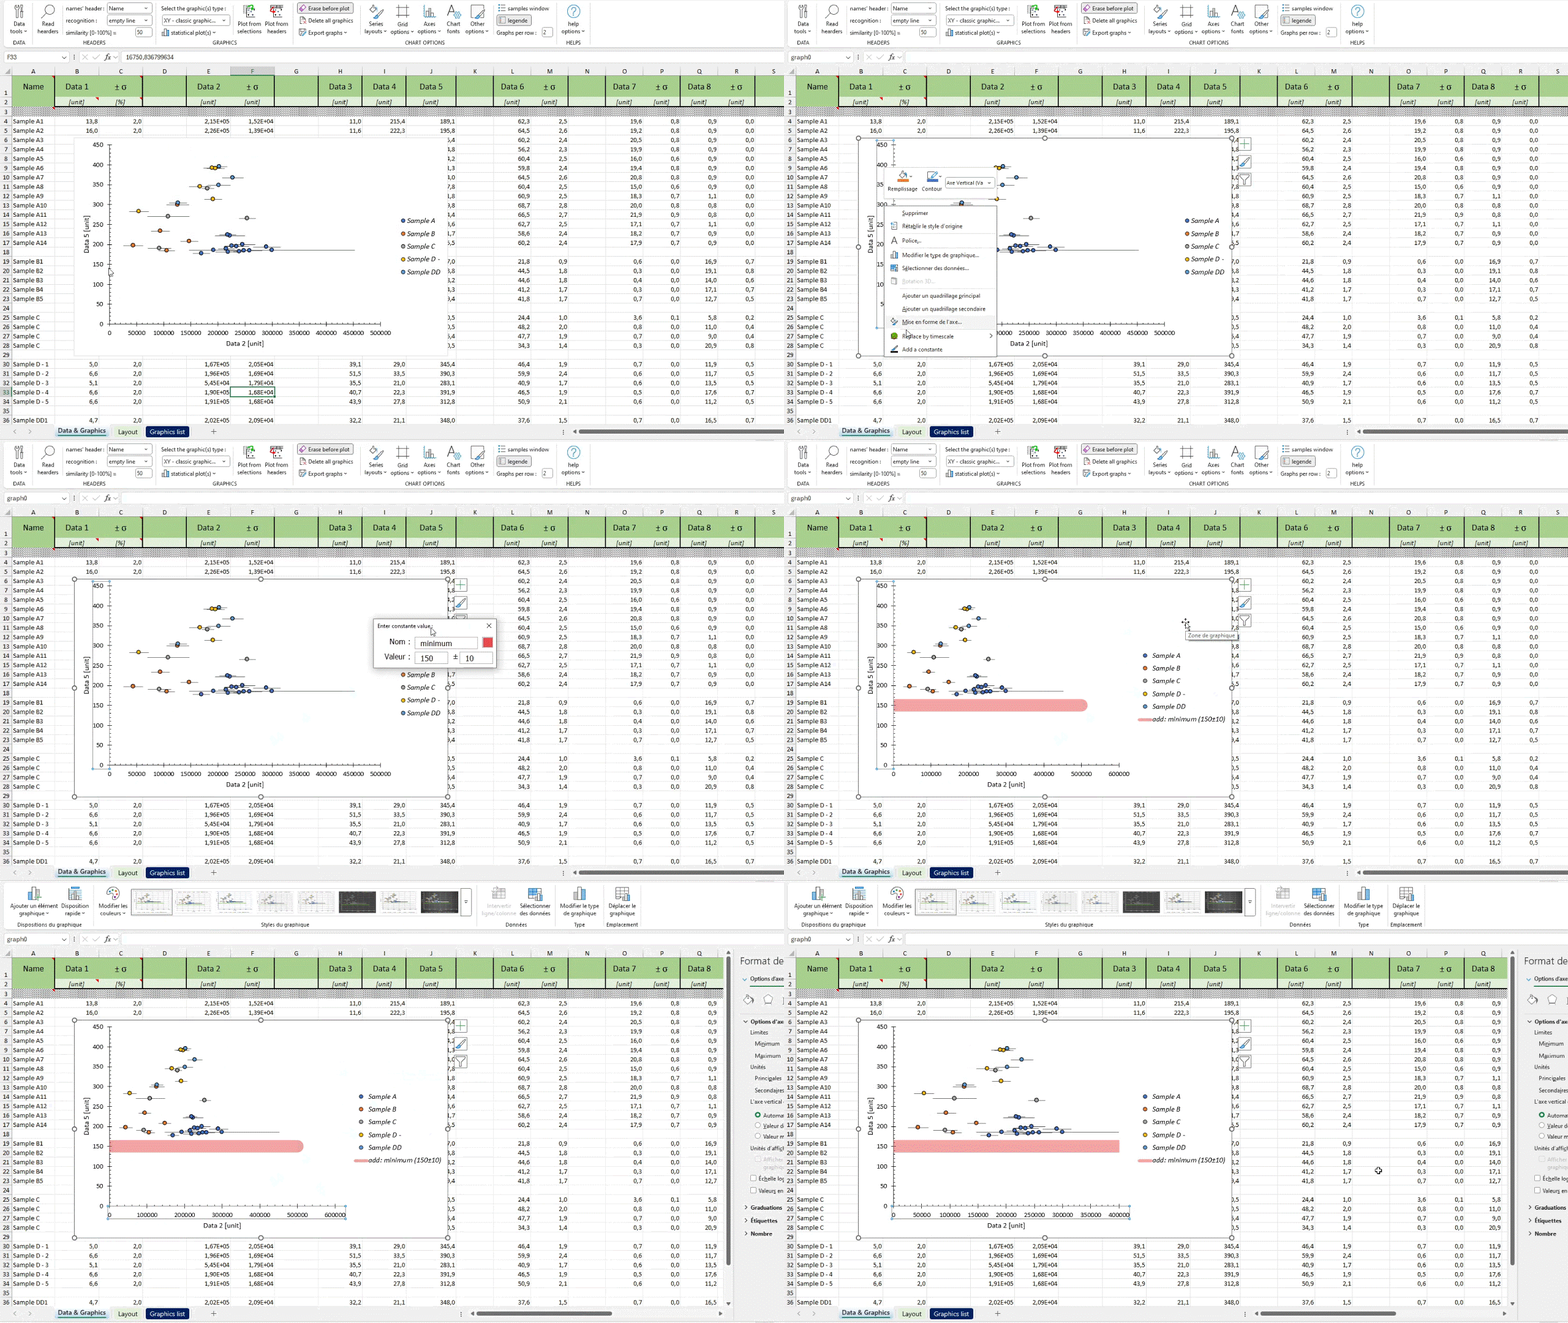
Adding the constant involves entering a name, a value, its uncertainty and a colour via a popup window. The width of the bar generated corresponds to the uncertainty, but no longer corresponds if the graph is resized.
zone: right-click on an axis
Add a function y = f(x) :
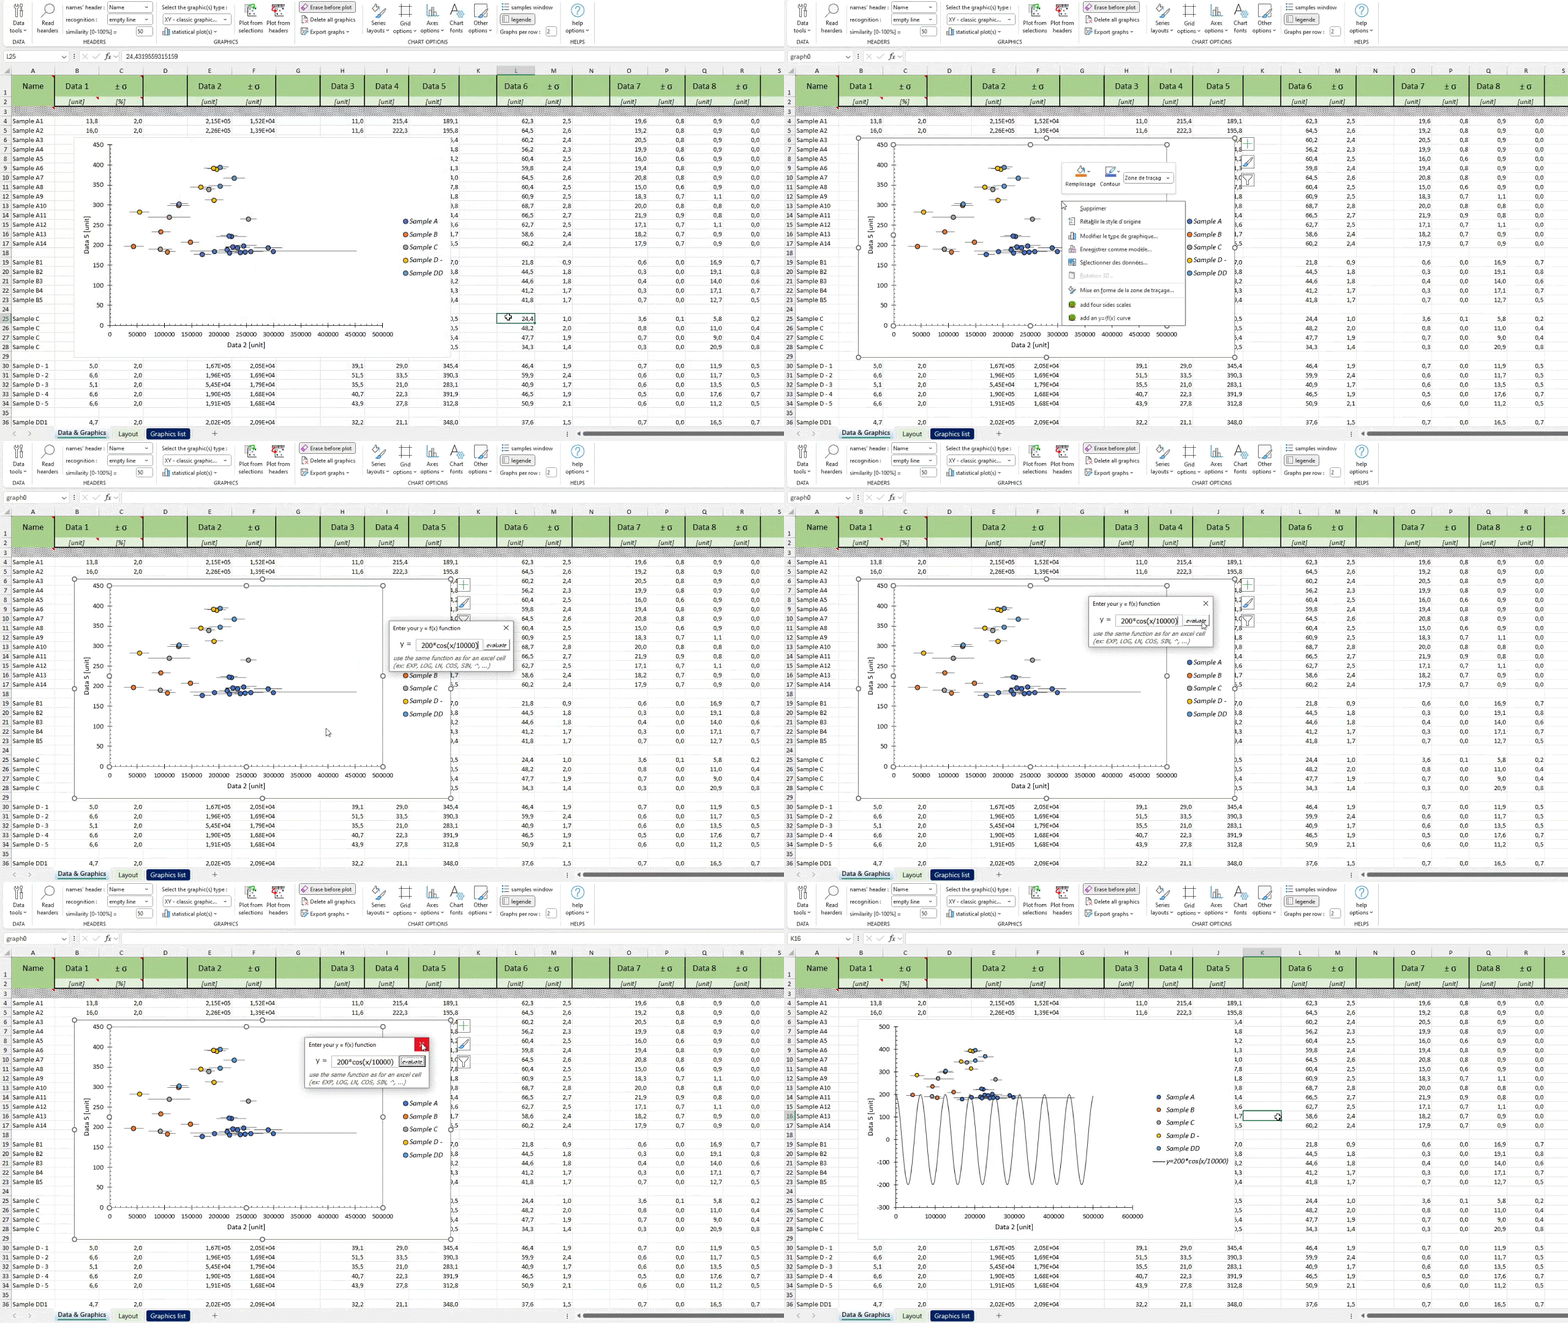
Adding a function is done via a popup window which allows you to enter the function f(x) and test its validity (for more information, see the help on the Function graph). For example, a possible function is y = x to make a 1:1 line.
zone: right-click on the graph zone
Framing / duplication of X and Y axes :
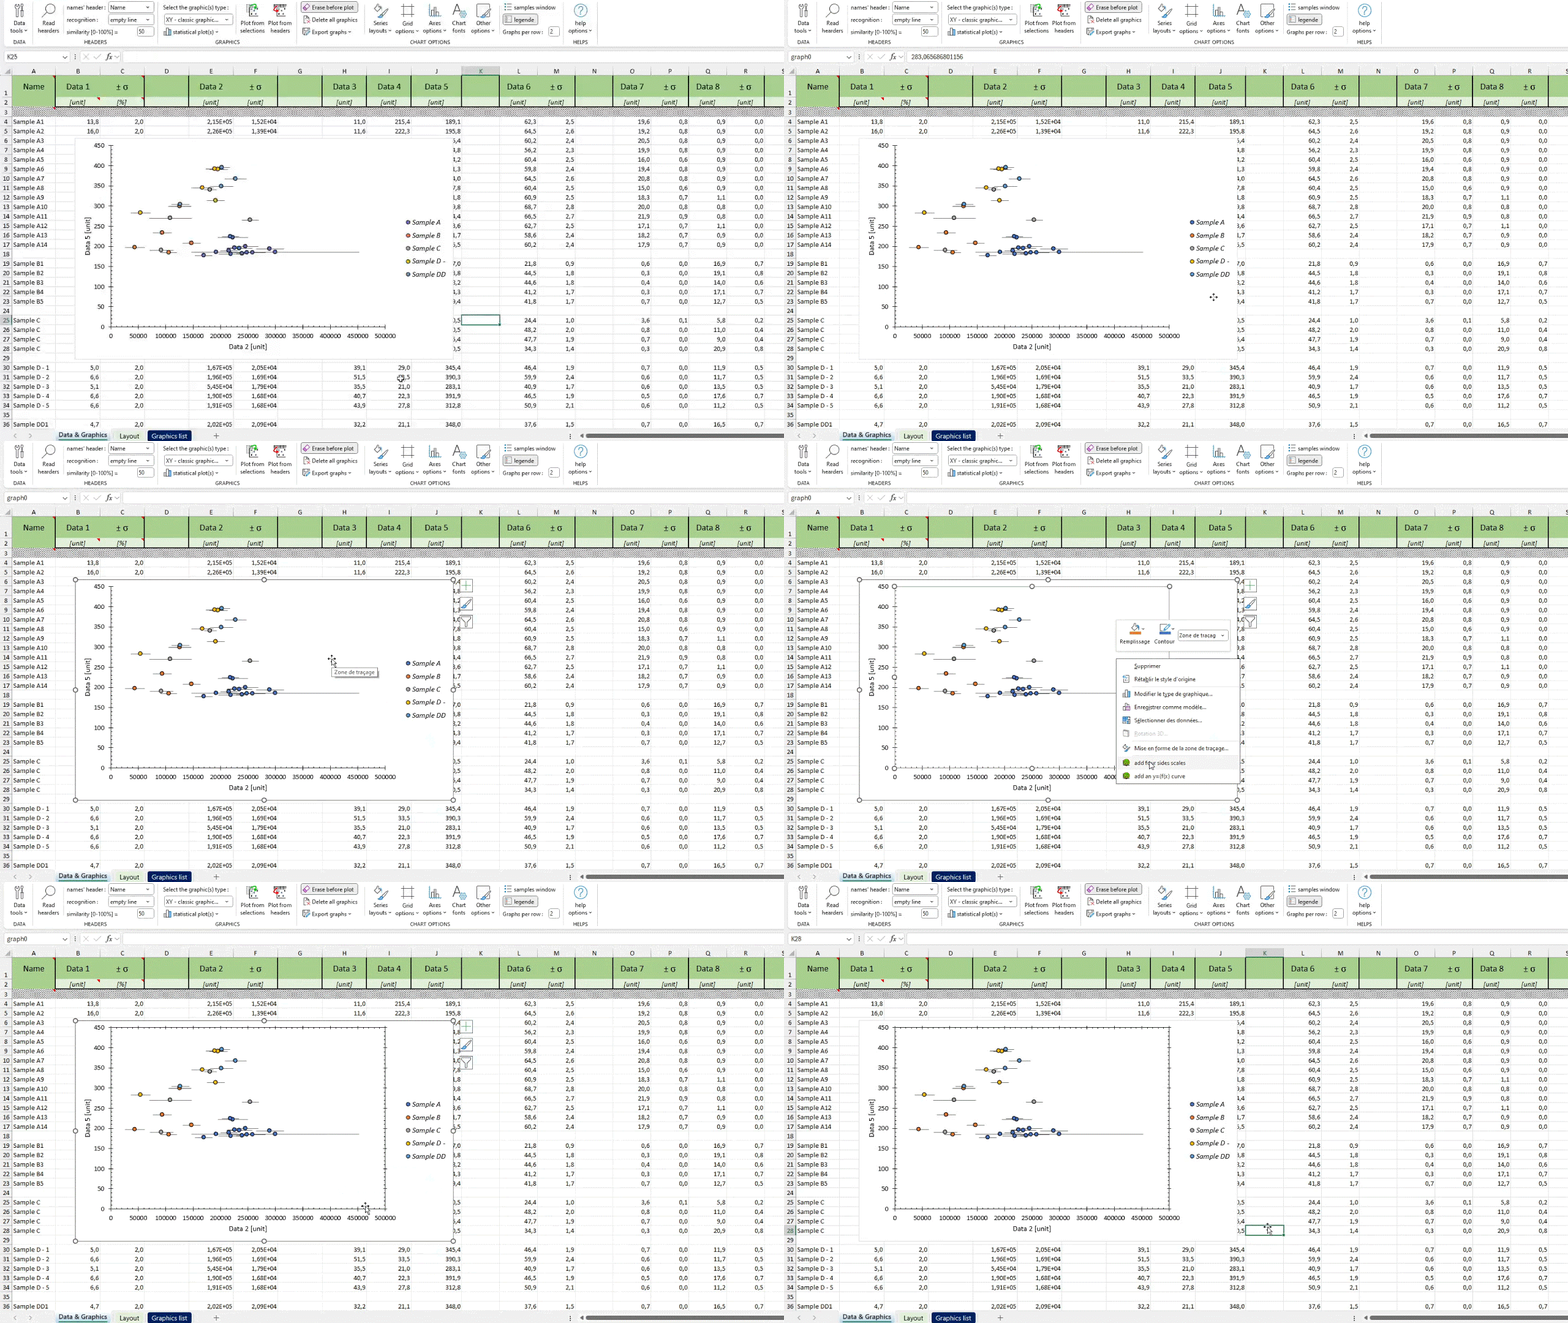
This option allows the secondary X and Y axes to be displayed and matched to the main axes. To update the axes after a change of scale, repeat the same action.
zone: right-click on the graph zone
Transforming an axis into a time scale :
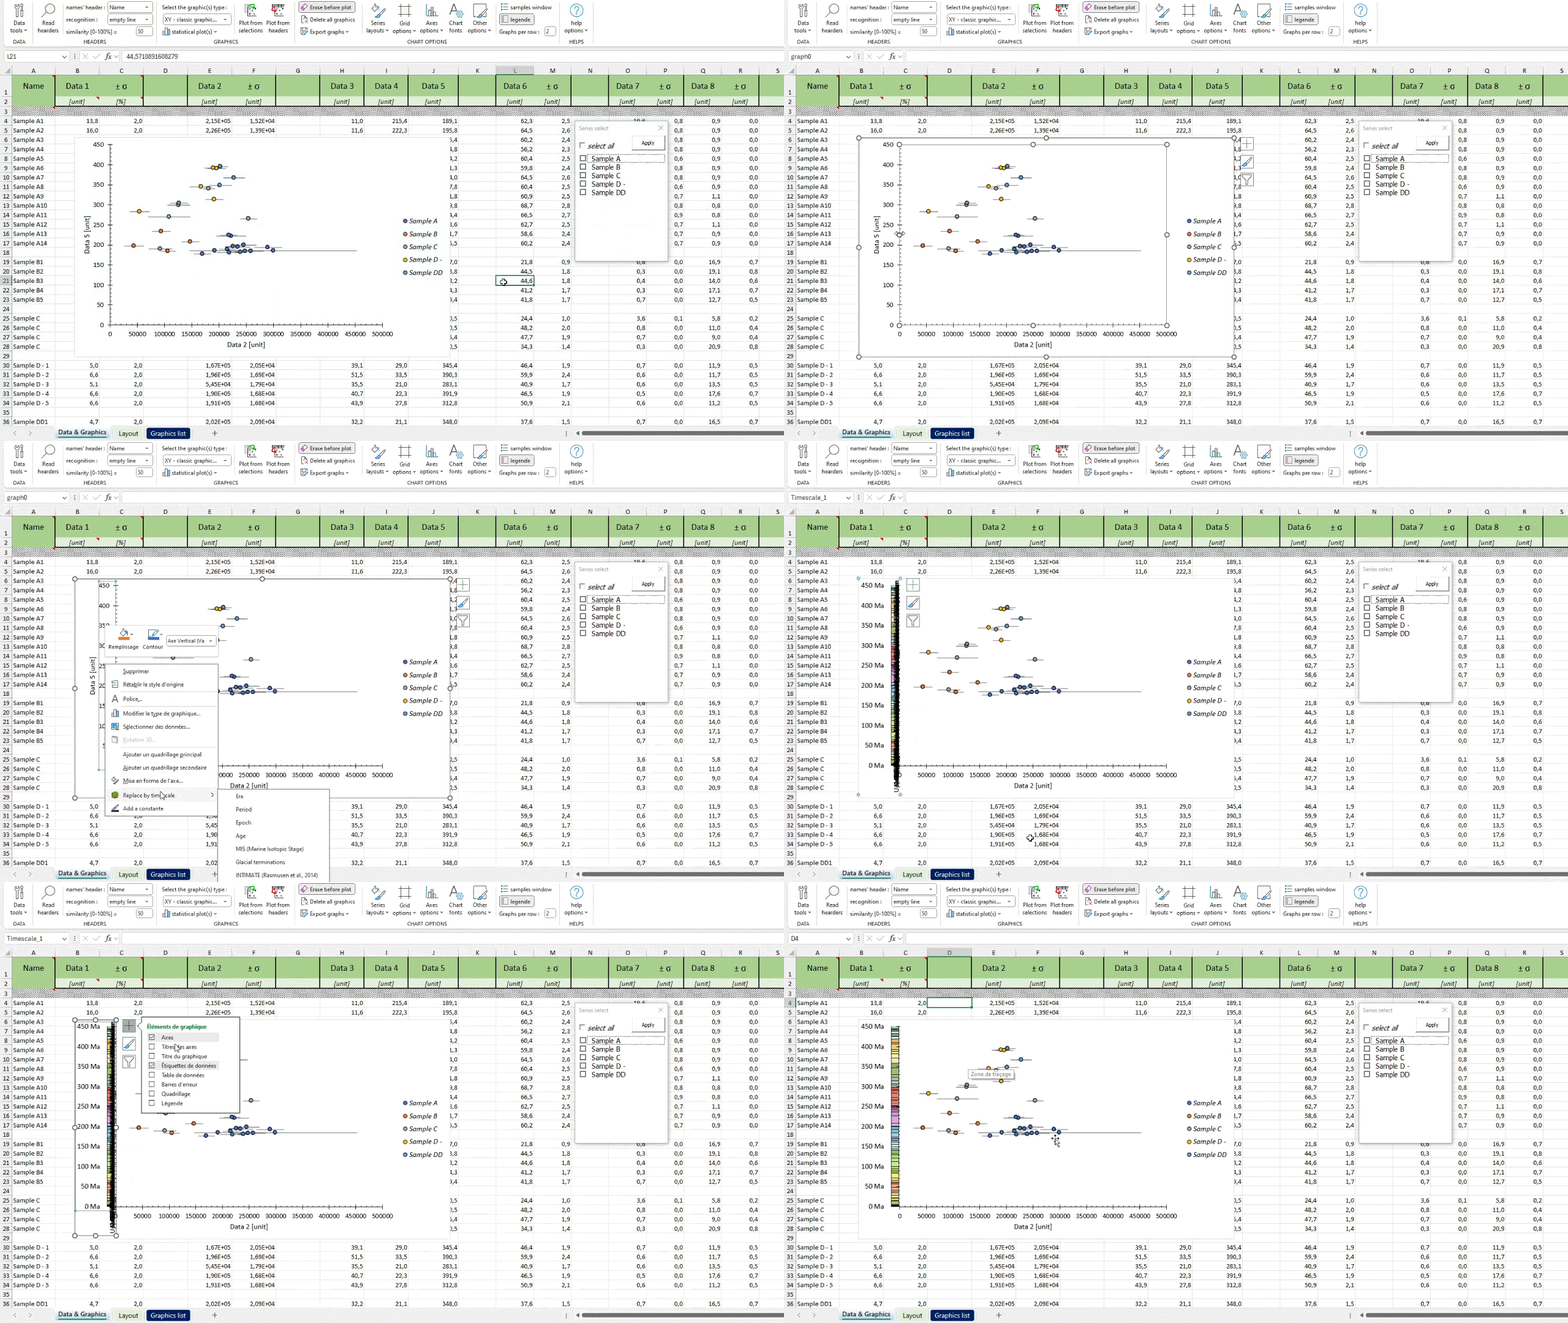
the axis is repositioned using the current minimum and maximum bounds, as well as the available space (it is therefore advisable to adapt the axis beforehand). For more information on the scales available and how to add them, see custom graphics – time scale.
zone: right-click on an axis